

How to Increase Lines per Call and Order Value in General Trade
by Nidhi Agrawal
November 3, 2026 | 09 min read
Share:
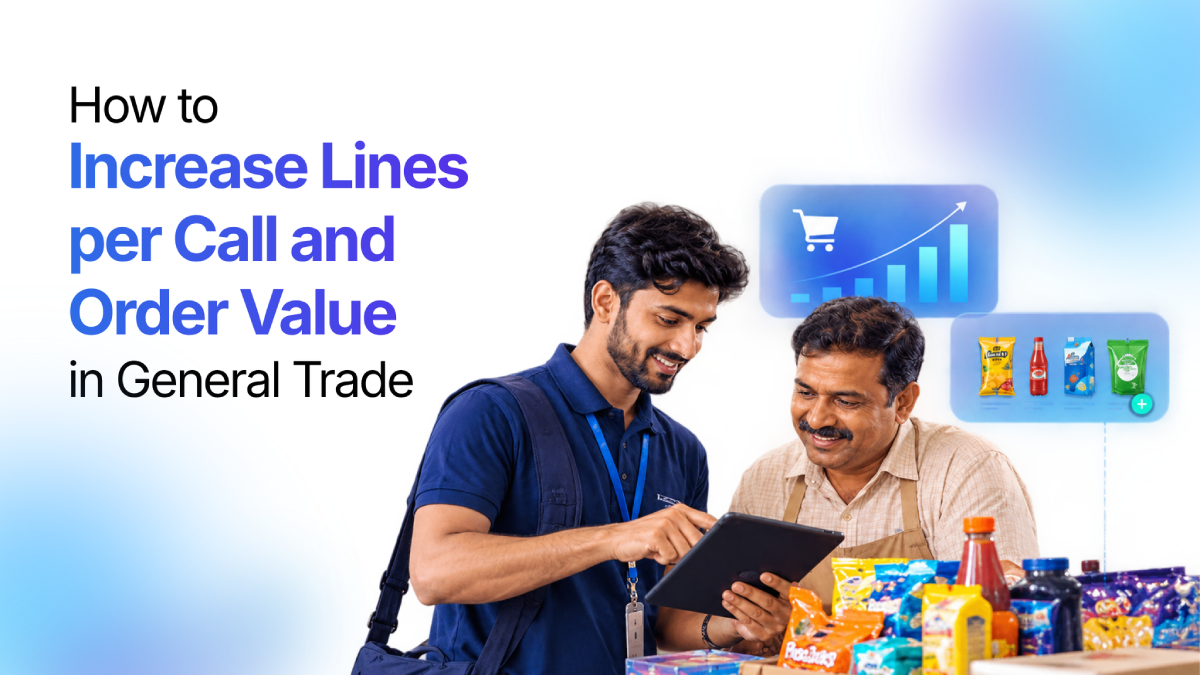
Lines per call, often called lines per successful call (LPSC), is the average number of different SKUs a rep sells in each productive outlet visit.
You raise it by showing the rep, before the order is keyed in, which SKUs each outlet is most likely to take: its regular reorders, higher quantities that similar outlets buy, products that nearby outlets sell and this one does not, and lapsed lines worth restarting. Live scheme prompts then help the rep complete the basket.
This guide covers the five levers, a way of thinking about order value that most teams skip (two multipliers and a coverage measure), a 30-day plan and a real case study.
Why does lines per call stall in general trade?
Basket breadth is under pressure from three directions.
- The rep sells what the rep remembers. Reps carry institutional knowledge about outlets, and the rest guess. The basket settles into the familiar few lines, call after call, because those are the ones the rep can recall without thinking.
- Growth is leaning on volume inside existing outlets. CRISIL’s May 2026 outlook for organised FMCG: revenue growth of 8-10% in FY27, mostly price-led, with realisations up 6-7% and volumes up only 2-3%, against 5-6% volume growth in FY26. When volume growth thins, the most reachable volume sits in outlets already on the beat. More lines, and more quantity per line, are how it is found.
- Shoppers have a faster alternative for top-up purchases. Redseer’s quick commerce analysis puts January 2026 quick commerce GMV at about ₹11,000 crore, roughly double a year earlier, with about 5.2 crore monthly transacting users and an average order value of about ₹460 after discounts. A kirana basket that is thin on range gives shoppers one more reason to top up elsewhere.
Why better execution pays most in traditional trade
In a September 2026 McKinsey article, Reckitt’s AI-guided store execution programme reported a sales uplift of roughly 2% in major modern-trade markets and 5-6% in traditional-trade-led markets such as Brazil. Where the rep drives the sale, guidance at the point of sale has the most room to add value. Lines per call is one of the clearest places to see it.
Five levers that raise lines per call
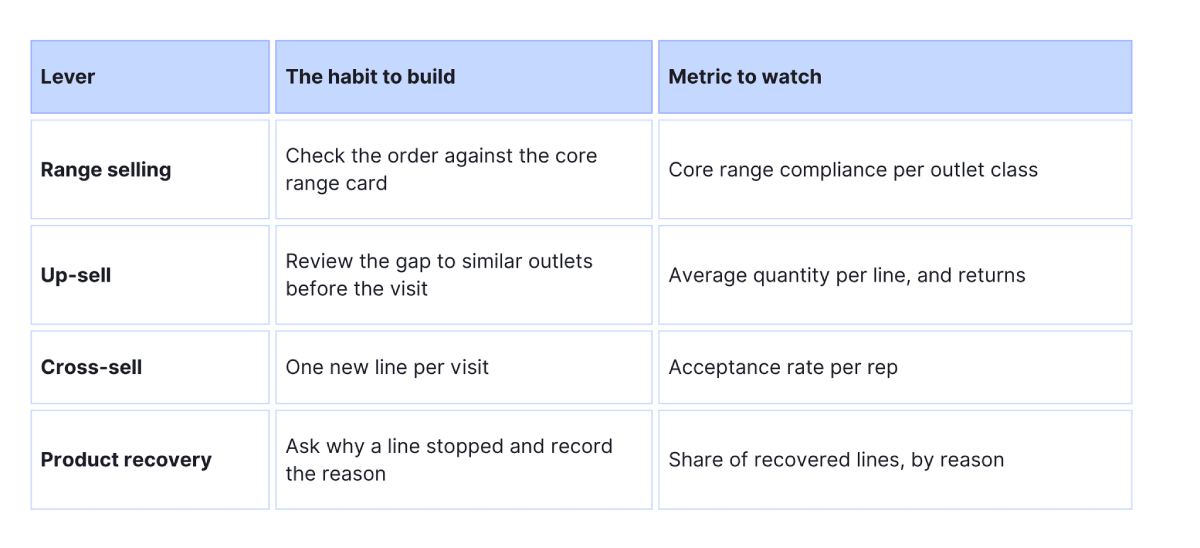
Each lever is a habit and is coachable. The suggestion types behind them, such as peer-based up-sell and cross-sell, are explained in our guide to AI suggested ordering.
This section covers how to turn them into field behaviour and how to tell whether they are working.
1. Range selling: check the basket against a core range
Give each outlet class a short core range card, not a full catalogue. Teach reps to compare the order against it before closing. The gaps are the quickest lines to add, because the outlet already knows and sells these products.
Coaching question: “What on the card is missing, and why?”
2. Up-sell: review the gap to similar outlets
Before a beat is worked, share which SKUs similar outlets take in larger volumes. Set two guardrails: the outlet’s space and its credit position. An up-sell that comes back as a return does not raise sales.
Coaching question: “Which SKU here is lighter than the beat norm, and can this outlet carry more?”
3. Cross-sell: one new line per visit
A rep who pitches a long list gets a polite no. A rep who pitches one well-chosen line per visit gets a decision. Track acceptance per rep to see who is pitching with conviction.
Coaching question: “What did you offer, and what did the retailer say?”
4. Product recovery: ask what changed
When an outlet has stopped buying a line, the useful question is why. Make reps record the reason in the app. Over a month, the reasons show whether the cause is distributor stock, scheme timing, price or space, and each cause has a different owner.
Coaching question: “What was the reason, and who can fix it?”
5. Scheme-led mix: show the gap before the order closes
A live scheme bar shows how much more the outlet must add to reach the next benefit. In the RI Co-Pilot order screen, an example prompt reads “add products worth Rs 250 more to save Rs 500”. Used well, it steers the order towards the right product mix instead of a blanket discount.
Coaching question: “How close was the order to the next slab, and what filled the gap?”
The angle most teams miss: two multipliers and a coverage measure
Most advice on lines per call treats it as the number to move. It is one input to a larger identity. For any outlet over a period:
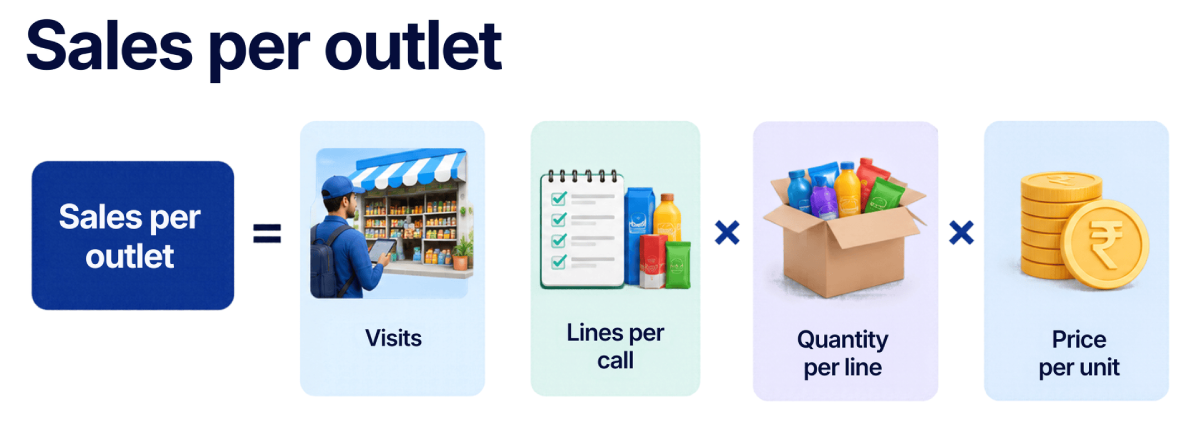
Lines per call is one of four terms. A team that watches only that term can miss gains, or losses, in the others.
The multipliers compound
A live example is Bizom’s RI Co-Pilot that lifted average sale quantity per outlet by 21% and average order frequency by 5% for a leading FMCG brand. If both were measured on the same outlets over the same period, and price and mix held constant, the combined effect on volume per outlet is:
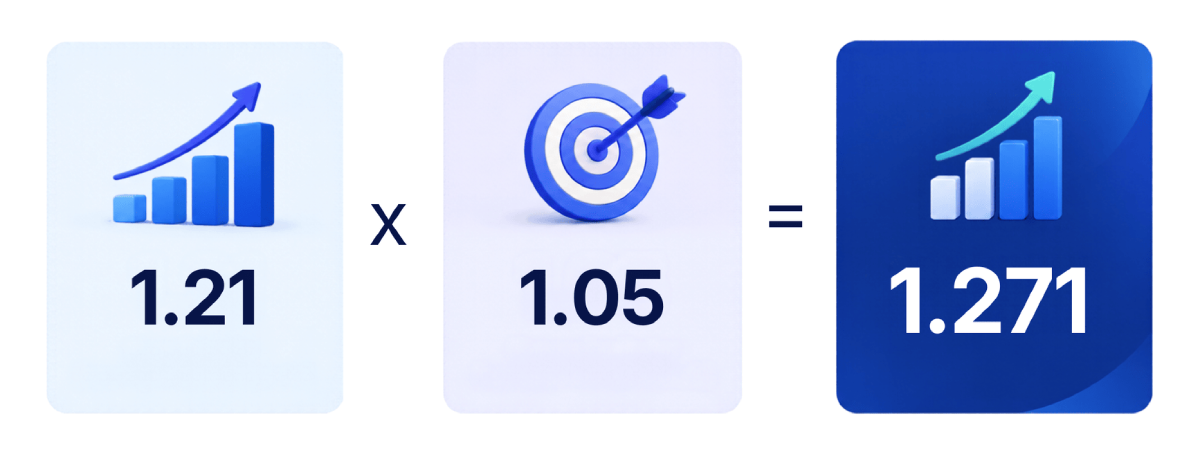
That is a rise of roughly 27% in volume per outlet. A modest gain in frequency multiplies a larger gain in quantity, so a dashboard that shows only LPSC hides two of the levers.
Track eligible outlet coverage
Suggestions need history. An outlet with no sales data gets none. That makes a third measure worth putting beside the first:

Coverage sets the ceiling on what any suggestion engine can deliver. It also tells you where to work: cleaner data capture and more visits turn ineligible outlets into eligible ones. Reporting uplift per eligible outlet, as well as across the whole base, makes the result easier to trust.
A four-number scorecard
| Measure | What it tells you |
|---|---|
|
Lines per call |
Breadth of the basket |
|
Average quantity per line (or per outlet) |
Depth of the basket |
|
Order frequency |
How often the outlet buys |
|
Eligible coverage |
How much of the base the tool can help |
A 30-day plan to raise lines per call
A short, controlled pilot gives you evidence you can defend. The plan below uses only the measures introduced above, and it does not assume any target. Set your own once you have a baseline.
| Week | Focus | What to do |
|---|---|---|
|
1. |
Baseline |
Pick the beats. Record lines per call, quantity per outlet, order frequency and eligible coverage for each. Split them into pilot beats and comparison beats of similar outlet mix |
|
2. |
Launch |
Brief reps on the five levers and, if you use a suggestion tool, on the four labels. Keep the brief short: what each label means and when to override |
|
3. |
Coach |
Review overrides and missed-line reasons with reps. Ride along on a few calls to see how suggestions are used in the outlet |
|
4. |
Read |
Compare pilot and comparison beats on the four-number scorecard. Decide where to extend and where to fix the data first |
Four mistakes to avoid
- Reading lines per call alone. A rise in lines can hide a fall in quantity per line, and the reverse.
- Pushing beyond what the outlet can carry. Check credit limit and pending collection before agreeing an up-sell.
- Counting ineligible outlets as failures. Outlets without history get no suggestions. Judge the tool on eligible outlets and work separately on coverage.
- Changing too much at once. Roll out the tool, new schemes and new targets together and you cannot tell which moved the result.
Case study: AI-guided selling at a leading FMCG company
A leading Indian household and fabric-care company distributes across modern trade, general trade and fragmented retail, from metros to rural markets. Its reporting was already digitised, yet reps still sold by habit.
Reports explained outcomes after the visit, not decisions made during it. Orders reflected comfort rather than outlet capacity, and SKU penetration varied widely across regions.
The rollout came in two stages. First, Bizom built the execution foundation: complete digitisation of outlet visits, standardised beat plans and call flows, and clean SKU-level order capture with schemes and returns. Then, intelligence was embedded in daily workflows, with suggested orders and smart nudges, real-time scheme and mix guidance.
| Metric | Result |
|---|---|
|
Average sale quantity per outlet |
+21%
|
|
Average order frequency |
+5% |
In this case, the execution discipline came first and intelligence second. Reps moved from order-taking to guided selling, and decisions aligned more closely with outlet capacity than with habit.
Contact us if you want to know more about this solution.

Nidhi Agrawal
Senior Product Marketing Manager
Nidhi is a seasoned marketing professional with a knack for translating complex business problems into relatable and easy-to-understand solutions. She works closely with leadership and senior management to bring their outlook into her write-ups.Join Our Newsletter
FAQs
01. What is a good lines-per-call number?
There is no universal benchmark. It depends on category, outlet class and pack range. Compare against your own baseline and against comparable beats.
02. How is lines per call different from strike rate?
Strike rate is the share of calls that produce an order. Lines per call measures the breadth of the order within those calls.
03. Should we link incentives to lines per call?
This should be handled with care. Pair it with quantity per line and returns, so reps are not rewarded for adding token lines that come back.
04. How long before we see a change?
A 30-day pilot shows direction, but seasonality can distort it. A comparison group matters more than the calendar.
05. Does it work for outlets with little history?
Suggestion tools depend on history, so coverage is the constraint. That is why eligible coverage sits on the scorecard.