

Essential SFA Metrics for Retail Every Manager Should Track
by Ishanth Turaga
June 11, 2026 | 05 min read
Share:
Tracking the right SFA metrics can turn raw data into meaningful business decisions. By focusing on measurements that align with your goals, you can cut through the noise, track real progress, and make smarter strategic choices.
What are SFA Metrics?
Sales force automation (SFA) metrics are numerical or measurable ways to represent and evaluate the performance of your field representatives and product lines. Managers use these metrics to evaluate the efficiency of sales operations, field teams and product performances to indicate whether or not there is room for improvement and to make more informed decisions based on real-time data.
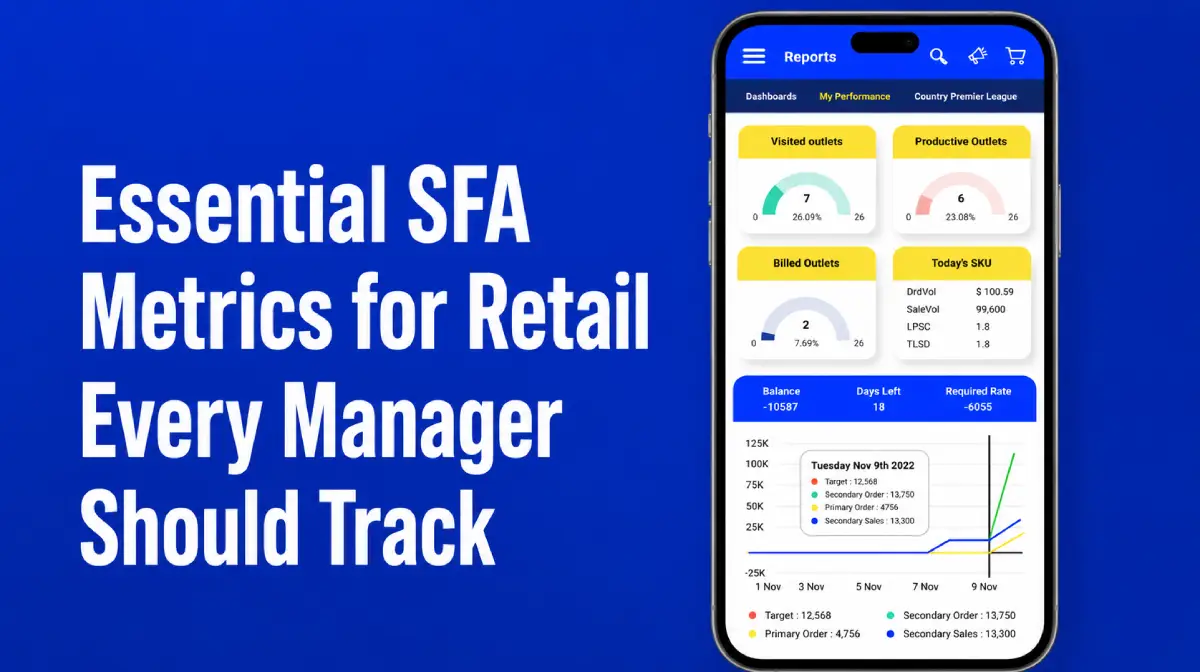
Instead of manually compiling reports from multiple sources, modern SFA software aggregates sales and field execution data in real time, allowing managers to track performance, compare territories and make faster operational decisions.
Overall, SFA metrics are a way to get a clear picture of the performance of an organisation, from employee productivity, sales and operational efficiency.
15 Essential SFA Metrics
Here are 15 important SFA metrics that managers should track to ensure team productivity, sales, and operational efficiency at scale.
1. Total Late Marked
This metric is calculated by counting the number of attendance records where a user’s check-in time exceeds the organisation’s predefined start time.
Most SFA platforms automatically compare attendance logs against working-hour policies to generate this figure. A consistently high Total Late Marked value may indicate scheduling issues, route inefficiencies or declining employee engagement. However, it is important for managers to draw conclusions based on long-term trends, not isolated incidents.
2. Unique Attendance Users
Unique Attendance Users is calculated by counting each individual user only once within the selected reporting period, regardless of how many times they marked attendance. This provides a clearer picture of workforce participation than total attendance records alone.
For example, if 50 field representatives are expected to participate in a product launch campaign but only 42 appear in the metric, managers can quickly identify adoption or staffing gaps that may affect execution.
3. Outlets with Orders (Planned)
This metric is calculated by counting the number of outlets on the Permanent journey plan (PJP) that generated at least one Productive call (PC) during the reporting period. Each qualifying outlet is counted only once, regardless of the number of orders placed. A high Unique PJP PC count generally suggests that route planning aligns well with retailer demand. If the metric remains low despite frequent visits, managers may need to review which outlets are being visited, how often they are being visited and whether those locations are the right fit for their products.
4. Unique Visited Beats
Unique Visited Beats measures the number of distinct routes or territories (also referred to as beats) covered by field representatives during a given period. Each beat is counted once regardless of how many times it was visited. For businesses focused on market expansion, this metric can act as an indicator of territory penetration. A sudden decline may signal coverage gaps, while steady growth can indicate broader market reach and improved retail visibility.
5. Strike Rate (Planned)
Strike Rate (Planned) is typically calculated by dividing the number of successful order-generating PJP visits by the total number of planned PJP visits, then multiplying the result by 100.
For example, if a representative completes 20 planned outlet visits and secures orders from 15 of them, the strike rate would be 75%. While benchmarks vary by industry, higher strike rates generally indicate stronger execution and outlet engagement, while indicating to managers the efficacy of the PJPs in producing orders.
6. Geo Compliant Orders
An order is considered geo-compliant when it is placed within a predefined geographic radius of the assigned outlet. The metric is calculated by counting all orders that meet this location-verification requirement.
For example, if an organisation requires orders to be placed within 100 meters of a store, any order recorded outside that range would not be considered geo-compliant. This helps validate that field activities are taking place at the intended locations.
7. Purchase Frequency
Purchase Frequency is calculated by dividing the total number of purchases made by an outlet by the selected reporting period. The metric can be analysed weekly, monthly or quarterly depending on business needs. A retailer purchasing once every week demonstrates a different demand pattern from one purchasing once every month. Tracking these differences helps managers identify high-engagement outlets and predict future inventory requirements more accurately.
8. Geo Compliant Bills %
This metric is calculated by dividing the number of geo-verified bills by the total number of bills generated during the reporting period and multiplying the result by 100.
For example, if 900 out of 1,000 bills are generated from verified outlet locations, the Geo Compliant Bills % would be 90%. Managers can use this metric to try to maintain a consistently high compliance rate and ensure field accountability.
9. Visit Frequency
Visit Frequency is calculated by dividing the total number of outlet visits by the number of unique outlets visited during the reporting period. This helps businesses understand how often retailers are being engaged by field teams. A very low frequency may indicate inconsistent retailer engagement, while an excessively high frequency could suggest that resources are being concentrated on too few outlets.
10. Effectively Covered Outlets
An outlet is typically considered effectively covered when a visit results in a meaningful activity, such as an order placement, product audit, survey completion or merchandising check. The exact criteria may vary between businesses.
For instance, a representative may visit 30 outlets in a day but only complete productive interactions in 24 of them. In this scenario, the Effectively Covered Outlets metric would be 24, providing a clearer picture of execution quality than simple visit counts.
11. Avg Time Spent / Outlet (Mins)
This metric is calculated by dividing the total time spent across all outlet visits by the number of outlets visited during the selected period. It helps managers assess the quality and consistency of retailer interactions. Unusually long interactions can be a signal to managers about the employee’s ability to effectively communicate to the retailer. Interactions that are too short can also be a cause for concern as the employee may be in a rush and therefore be causing operational problems.
12. Order Frequency
Order Frequency measures how often an outlet places orders within a selected time frame. It is typically calculated by dividing the total number of orders by the number of ordering outlets. Managers can use this metric as a periodic aim – for example, increasing outlet frequency from 3 to 4 per outlet every month. Additionally, consistently high order frequency can signal strong retailer engagement and stable demand, and fluctuations can highlight issues.
13. Average Order Value Per Outlet
This metric is calculated by dividing the total value of all orders by the number of ordering outlets during the reporting period. It provides insight into the revenue contribution of each outlet. For example, if total order value reaches ₹2,000,000 across 400 ordering outlets, the Average Order Value Per Outlet would be ₹5,000. This metric lets managers get a gauge not only on the effectiveness of sales initiatives but also helps identify high-value retailers for the business.
14. Visited, But No Transaction
This metric counts the number of outlets where a field visit was completed, but no order, sale or other qualifying transaction occurred. It highlights missed opportunities within the sales process.
For example, if a representative visits 50 outlets and only 35 generate transactions, the remaining 15 would contribute to the Visited But No Transaction metric. A consistently high value may indicate issues such as poor retailer engagement, product availability challenges or ineffective sales execution.
15. Outlets Ordered / User
This metric is calculated by dividing the total number of ordering outlets by the number of sales representatives who captured orders during the reporting period. This metric helps managers assess sales productivity and understand how effectively field teams are converting outlet visits into orders.
For example, if 600 outlets place orders and 30 representatives are active, the metric would be 20 outlets ordered per user. Higher values generally indicate stronger sales execution.
A practical, 5 Step Framework On Choosing The Right Metric For Your Business
Follow this 5-step framework to ensure that you choose the right SFA metric as per your business goals.
Step 1: Set your goals
Before taking on sales performance analysis, you need to know what success means for your business. Be it higher employee attendance or further reach of your products physically, establishing this goal will simplify things a lot more down the line.
Step 2: Focus on outcomes, not numbers
It’s easy to get lost in numbers that look impressive but don’t drive results. Managers should prioritise metrics that reveal territory coverage, retail engagement and sales effectiveness—such as Unique Visited Beats, Purchase Frequency and Strike Rate—over metrics that offer little actionable insight on their own.
Step 3: Identify Leaders and Laggers
Lagging indicators tell you what has already happened, while leading indicators help predict future performance. Don’t get caught up in either; a balanced mix of both will allow you to monitor current results while also spotting opportunities and risks before they impact the business.
Step 4: Quality > Quantity
Tracking too many metrics creates noise and makes decision-making harder. Select a handful of key metrics that your team can influence directly and that provide clear guidance on what actions to take next.
Step 5: Rinse and repeat
Metrics shouldn’t be the same throughout your business cycle – they have to keep changing. Revisit them periodically to ensure they still align with your goals, reflect current priorities, and provide the insights needed to make better decisions. The best metrics framework is one that adapts as your business grows.
Apps That Help You Track SFA Metrics
We’ve listed the top apps that help you digitise and optimise field operations while also tracking essential SFA metrics.
Ranking | Company name | Region | Suitable for | Relevant SFA Metrics Supported |
|---|---|---|---|---|
1 | Salesforce | Global | Enterprises | Purchase Frequency, Strike Rate, Average Order Value Per Outlet, Visit Frequency |
2 | Bizom | India, Southeast Asia, Middle East, Africa | Enterprises and Mid-markets | Unique Visited Beats, Outlets with orders (Planned), Strike Rate (Planned), Geo-Compliant Orders, Purchase Frequency, Geo-Compliant Bills %, and more |
3. | Beatroute | India, Southeast Asia, Middle East | SMEs | Effectively Covered Outlets, Visit Frequency, Outlets Ordered / User, Strike Rate (Planned) |
4. | FieldAssist | India | SMEs | Total Late Marked, Unique Attendance Users, Outlets with orders (Planned), Visit Frequency |
5. | Pepperi | North America, Europe | Enterprise and mid-market | Order Frequency, Average Order Value Per Outlet, Purchase Frequency, Outlets Ordered / Use |
*As per May 2026
Join Our Newsletter
FAQs
01. Can tracking too many SFA metrics hurt performance?
Absolutely, while it is important to use real-time data - managers can easily be overburdened by too many sources and figures. The most beneficial way to make better business decisions is to pick out metrics that will better align with business goals - rather than everything available.
02. Which SFA metric is the best indicator of field productivity?
“Field productivity” can mean different things. While some businesses will want optimised beat plans for employees, others will prioritise orders. That being said, metrics such as Strike Rate, Unique Visited Beats and Purchase Frequency often provide a balanced view of how effectively field teams are converting visits into meaningful business outcomes.
03. What happens when SFA metrics are viewed in isolation?
Looking at a single metric can create a misleading picture of performance. For example, high outlet coverage may seem positive, but if the strike rate remains low, field visits may not be generating results. Managers should analyse multiple metrics together to gain a more complete understanding of sales performance.
04. How can managers turn SFA metrics into action?
The value of SFA metrics lies in the decisions they support. By identifying trends, performance gaps and execution challenges, managers can adjust routes, improve resource allocation and optimise sales strategies based on measurable outcomes rather than assumptions.
05. What should managers do when a metric starts declining?
While declining metrics may seem alarming, they should be seen as more of a warning sign. Investigating related metrics and identifying potential causes before implementing corrective actions can avert performance decline, retailer relationships and loss in market coverage.