

Save Over 50% of Your Costs With no Effort on RTM
Save Over 50% of Your Costs With no Effort on RTM April 24, 2024 | 02 min read Share: Share on twitter Share on linkedin Share ...

Your Groceries are Secret Agents and It’s Not What You Think
Your Groceries are Secret Agents and It’s Not What You Think April 16 2024 | 03 min read Share: Share on twitter Share on linkedin Share ...
How do Transformation Costs become Turmoil Costs?
How do Transformation Costs become Turmoil Costs? April 10 2024 | 03 min read Share: Share on twitter Share on linkedin Share on facebook Share on ...

Earth Owes Your Business a Second Each Year!
Earth Owes Your Business a Second Each Year! April 3 2024 | 03 min read Share: Share on twitter Share on linkedin Share on facebook Share ...

Navigating the Data Deluge: MDM is Your North Star
Navigating the Data Deluge: MDM is Your North Star March 27, 2024 | 02 min read Share: Share on twitter Share on linkedin Share on facebook ...

Tackling Tangles & Building a Robust Global Supply Chain
Brands often can’t decide when is the optimal moment to expand globally. Below are several factors that may aid in making this crucial decision.

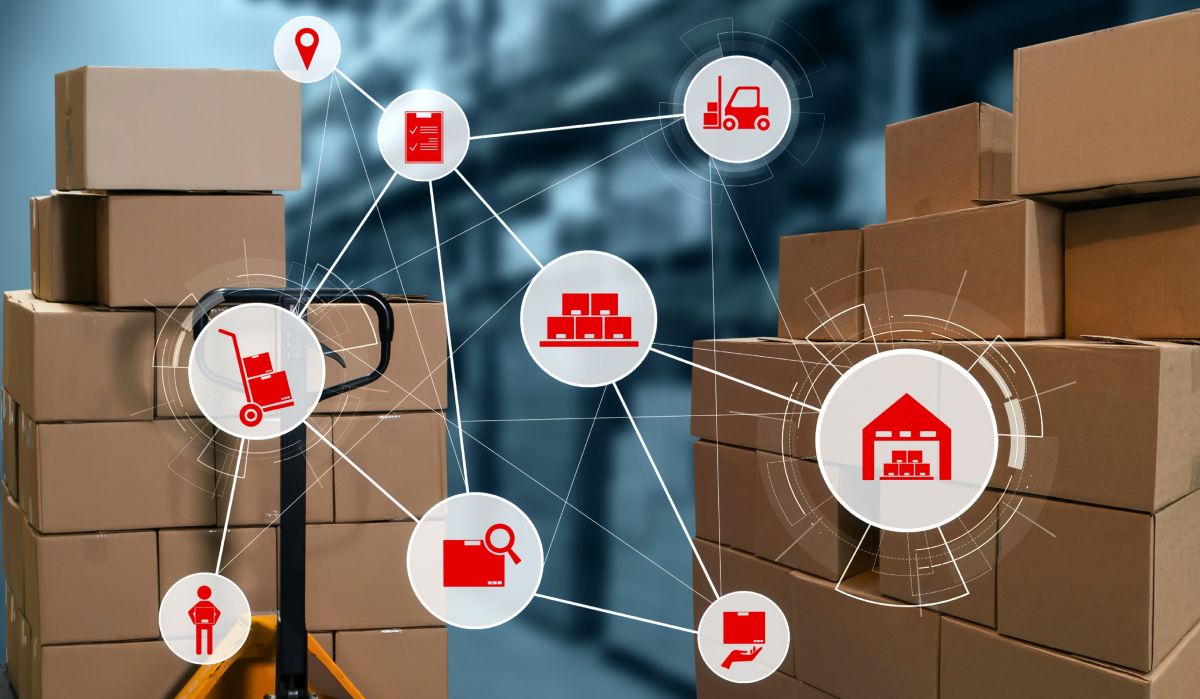
Decluttering D2C: Unlock the Power of Inventory Management
Like pieces of a puzzle scattered across multiple sales channels, inventory presents both a challenge and an opportunity. Direct-to-consumer (D2C) brands face immense challenges when ...
Can Digital Transformation buy you a 25-day Vacation?
Can Digital Transformation Buy You a 25-day Vacation? March 06 2024 | 03 min read Share: Share on twitter Share on linkedin Share on facebook Share ...

Boarding Now: CPG leaders are Gearing Up for the AI Express!
Boarding Now: CPG Leaders are Gearing up for the AI Express! February 28 2024 | 03 min read Share: Share on twitter Share on linkedin Share ...

Bizom bustles up a buzz around CPG in Namma Bengaluru
Bizom Bustles up a Buzz Around CPG in Namma Bengaluru February 22 2024 | 05 min read Share: Share on twitter Share on linkedin Share on ...

Getting Cheated Everyday?
Getting Cheated Everyday? February 14 2024 | 02 min read Share: Share on twitter Share on linkedin Share on facebook Share on whatsapp Do you think ...

Make the Twin Transition Jump with 4.0 Retail Tech
Make the Twin Transition Jump with 4.0 Retail Tech January 07 2024 | 02 min read Share: Share on twitter Share on linkedin Share on facebook ...

Adapt, Thrive & Shine Through Business Uncertainty Like The Northern Lights
Have you ever wondered about the enchanting spectacle of the Northern Lights, painting the night sky with vibrant hues, how is your RTM strategy related ...

How can GenAI help augment existing RTM execution?
Explore the future of Route to Market (RTM) execution with GenAI. Elevate precision, engagement, and scalability in Route to Market execution. Stay ahead with innovation

Striking the Right Data Harmony in Retail
Imagine the world of retail as a grand symphony, where success is orchestrated through a harmonious blend of various elements.

Helping you know your shelf
Product placement, customer interaction, and inventory movement leave a trail of valuable information.

Freeze🥶363 Liquid Suspicions In Supply Chain
Freeze🥶363 Liquid Suspicions In Supply Chain January 03 2024 | 02 min read Share: Share on twitter Share on linkedin Share on facebook Share on whatsapp ...

Retail Stores head for Conflation in 2024
Retail Stores head for Conflation in 2024 December 28 2023 | 03 min read Share: Share on twitter Share on linkedin Share on facebook Share on ...

Your Ticket to Last-Mile Brilliance!
In the ever-evolving landscape of the consumer goods industry, a paradigm shift is underway with the introduction of the Bizom Tertiary Sales App.

Is your duplicate data forcing you towards a lower growth orbit?
Ever wondered about the delicate balance that keeps our planet twirling smoothly on its axis?

Cut Variance with Variety in Retail
Remember the first time you cried? No, obviously you can’t. But definitely, it was because of something that would seem meaningless now.

Close the ETCD Gaps in Retail Distribution
How does the world's biggest distribution chain keep Earth a safer place?
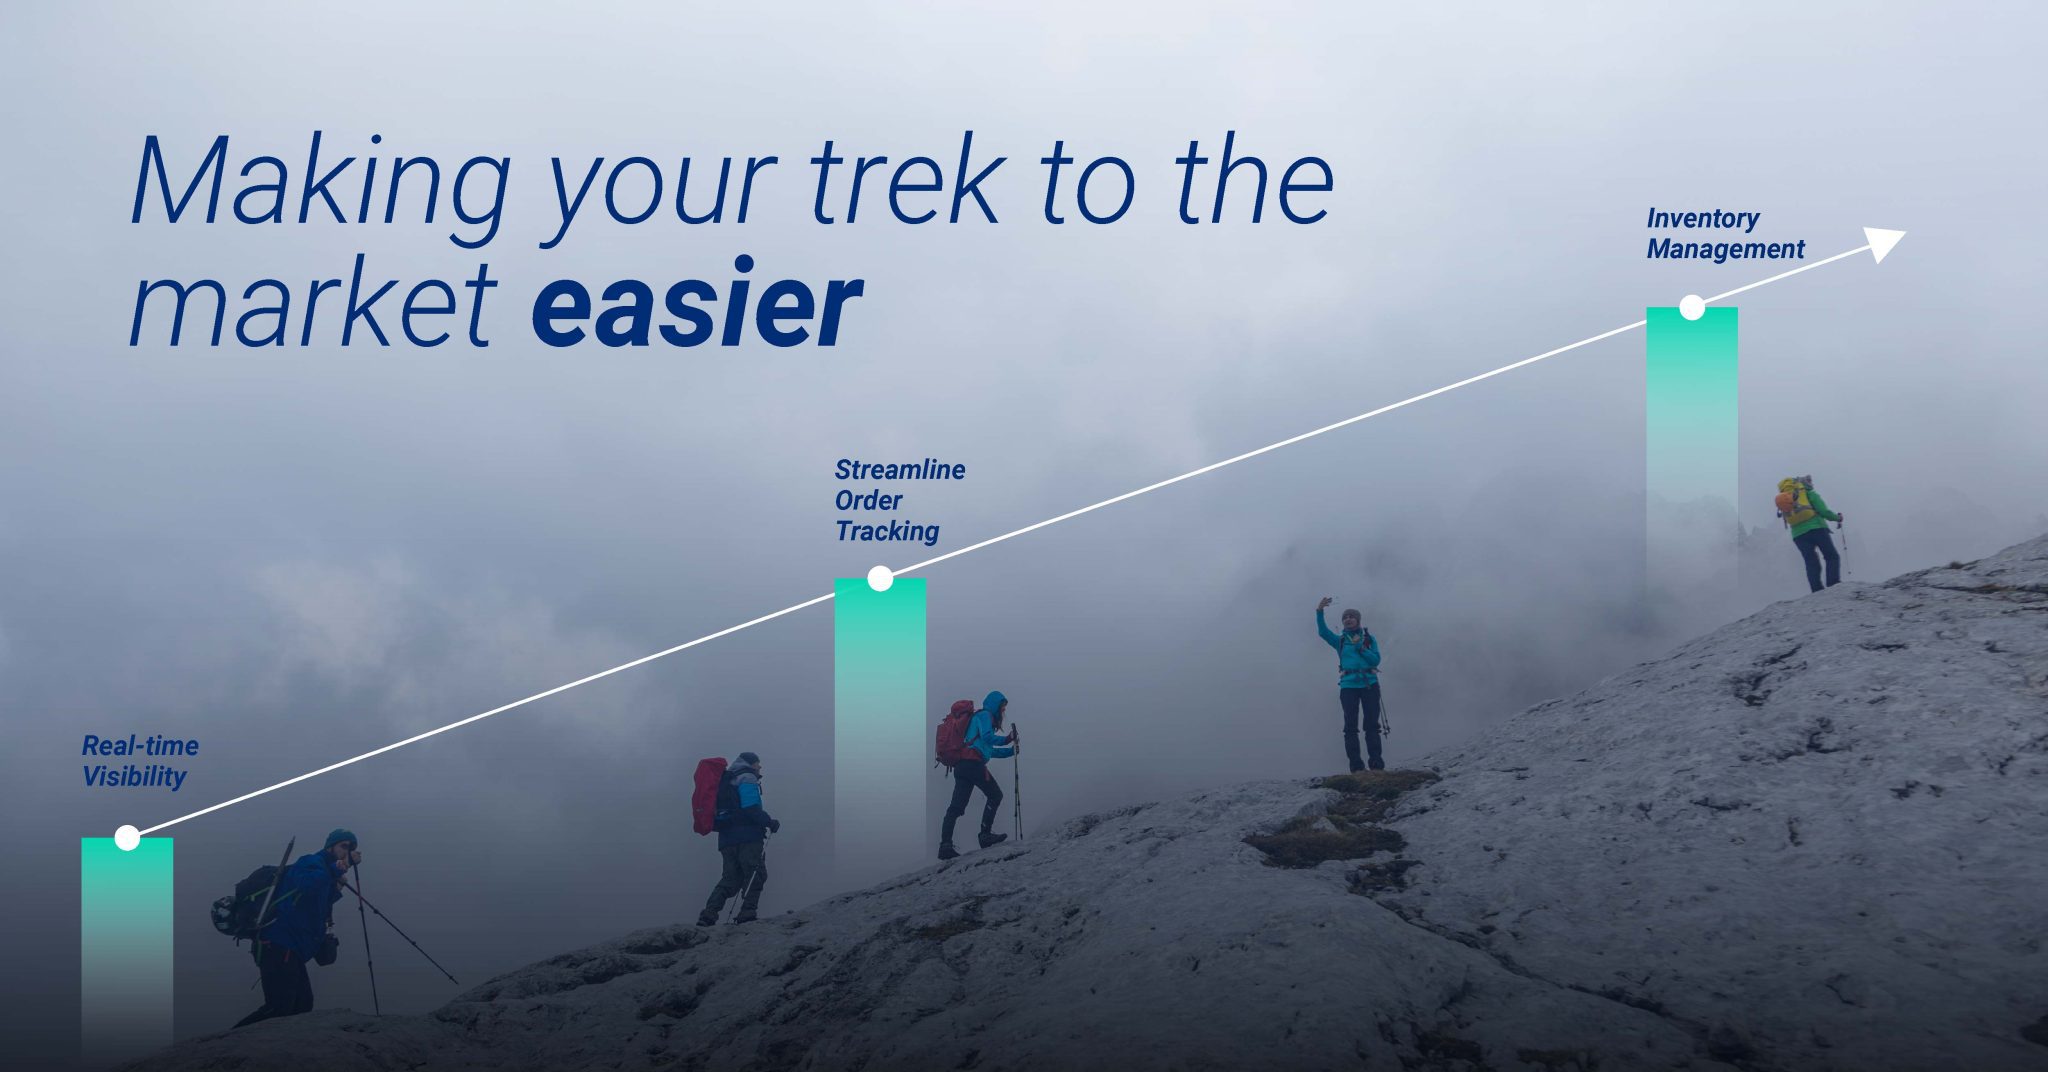
Making Your Trek to the Market Easier
Bizom help businesses make the Route-to-market for CPG players easier each day.
Seamlessly Capture Offtakes for Ultimate Productivity
Capture the offtake visibility to understand which product is picked by consumers, and at what price and time.

What Jobs Do Your Products Get Done?
First there was void, and then came products to make life vibrant.

Saw the World Cup Score. But missed the Sales Score?
Ladies and gentlemen, welcome to another thrilling game in your world of commerce!

Topper’s Trick to Shoot Up Sales
What does failing feel like? In games, work, exams, relations? The sting can differ based on the importance we give.

Manager Impossible: The Inside Joke on Managerial Optimization
With BIZOM TPM, brands can efficiently plan, execute, and track their trade promotions...

FMCGs Path to Productivity
With BIZOM TPM, brands can efficiently plan, execute, and track their trade promotions...

Get AI Vision For Retail Execution
This AI technology can even fix and stitch broken images....

From Riverbanks to Retail Shelves: Distribution Dynamics
Depending on the terrain (the pulse of the market), it shows how each action for every product should be taken.

Climbing Up The Retail Mountains Solo
To keep your managers in the right line, retail intelligence lights up the entire distribution.

Unlocking Success: How Retail Intelligence Shatters the Average Mindset
No matter how big is your task list, retail intelligence gets you covered to ensure you are always at the peak of your productivity.

Embracing the Retail Accordion
By understanding the journey of the retailer, brands can plan schemes and trade promotions more effectively.

Why Leaders need Resonance before Revenue
An intelligent swing that let's you prompt each field salesman exactly what to sell when they visit a store.

Make the managerial magic happen
Bizom Manager's App helps to look into the right set of success metrics and make decisions accordingly.

Ownership Doesn’t Mean Doing It
True ownership doesn’t mean doing it yourself. It means to get it done no matter what it takes.

Mixing Atomism & Holism in Sales
When the bleak sales numbers flash on screen during the team meeting, it screams only one thing.

Bend Realities To Win Impossibilities
To bend reality you gotta be extraordinary, and a visionary.

Enhancing Assortment Planning and Distribution Optimization
This technology enables sales leaders to optimize retail execution, ensure store compliance, and improve in-store sales and marketing ROI on a large scale.

Only Selling a Brand, not Building it?
Cows were the first to be branded. Shepherds used to stamp a symbol on their cows to identify them.

Power Up The Business Neurons
There are 86 billion of them living inside you, with the sole purpose of making you live to the fullest.

Finding The Gut Fuel
The decision of when to accelerate and when to brake, determines how the ride goes ahead.

Why Capacities eat Capabilities for breakfast
There are two things in life, the more of which you do, you can just keep doing more. It’s sleeping and eating.

Boosting Performance with Effective Strategies
We understand the importance of achieving growth targets and driving success in today's competitive market.

How Does Right Become Right?
Use an intelligent tool like Trade Promotions Management tool to monitor the effectiveness...

Can you Optimize Retail Execution by 3x?
Is Superman the alter ego of Clark Kent, or is Clark Kent the alter ego of Superman?

See the Changing Colors in the Sales Depth
With a Tertiary Sales app, you can capture every sales movement at retail fronts.

Charlie, Chaplin & Tertiary Sales
Monitor the beating pulse of every retail shelf and drive enterprise-wide reporting...

Revolutionize beauty retail by capturing tertiary sales
A Tertiary Sales App can provide the insights and tools needed to streamline sales performance...

What makes the Manager move?
Is it done? What’s the progress on that? How did that one go?

Streamline Team Operations
In the fast-moving consumer goods (FMCG) retail industry, automation has become a key tool for improving efficiency and profitability.

The Colours of Intelligence
There are actually so many colours that even if each human being on Earth was of a unique colour, there will still be too many ...
Toothpicks of B2B Sales Transformation
If your everyday business glitches were like detritus, do you have toothpicks (tools) to make them gone?

Can Leaving Always Mean Living?
In life, yes! Leaving more - may it be cities, bad habits or toxic relationships, lets more live more. But in business, what does leaving ...

You can, like Batman.
The mask, the cape, the super-cool cars and the Batcave, can probably not happen. But like the prince of Gotham, you too can have real-time ...
From Planning Your Diet To Planning Your Retail
The one question every human thinks every day is what am I gonna eat today and answers differ based on cost, our surroundings, diet, availability, ...

Data and the Distribution Maze
You, your team and even the boss - everybody wants data. Yet nobody knows the best way to get it. So the search continues.

From Burning CDs to Burning the Revenue
Stocking our memories or games like Road Rash or Mario, or even creating that perfect music playlist with those timeless classics. CDs truly used to ...

Eliminate The Shelf Snooze
Hitting yourself in the face might work better than hitting that snooze button. Seriously.

How Loss Aversion Causes Sales Disruption
Why did Charlie get to inherit the chocolate factory? How was Noah able to save the world on an ark?

How to grow instore sales 10X with Smart Merchandising
Consumers always want the right products at the right time to make the right and convenient buying choices. “What is seen, is sold”. Consumers buy ...

Building availability for viability
What’s the most constant part of your every day? It’s probably scrolling your smartphone. You might even forget to drink water for hours, but tapping ...

From 🌍 Earth’s core to the shelves at stores.
Around 2900 km below the ground we breathe on, the Earth is changing. Recent research predicts that the planet’s inner core that’s surrounded by a ...

Focus needs foundation, trade needs tracks.
When racehorses run the mile, the one fundamental principle they follow is absolute focus. But what’s the foundation of this focus? Is it the horse ...

Leverage inefficiencies to boost sales productivity
In every movie, no matter how powerful the villain is, the protagonist always wins the show by leveraging some situational inefficiencies. From The Sound of ...

Caring right, can get the Carry optimized
That chair in your house that’s existing to be your cloth hanger, could be more. It could’ve become what it was meant to be. A ...

A year of building together – Rewinding 2022
If everyone is moving forward together, then success takes care of itself. - Henry Ford

A resolution for a revolution
What’s your impact as a leader? Business growth? Team performance? New policies? Well, it runs deeper than that. A leader sets the foundation for how ...

Deploy the Hot Stove Rule in Sales
Well, no. This is not a LinkedIn motivational post from the kitchen. The Hot Stove Rule is a management principle that talks about how employees ...

Give sales a Patronus touch
No, we aren’t talking about selling in the Wizarding World. (Although, how cool will it be if market visits could start from platform 9 ¾ ...

Sell more soundly with traffic lights
Traffic lights, which were introduced by the British, are more in use than the English language.

A Superpower For The Prime Homemakers
Where’s this? Where’s that? Mothers or wives are bombarded daily with such questions. Because they know it all. They make our homes.

Personalize the tech in your distribution
The voice recorder on our phones is possibly the least used feature by most of us. But did you know for a salesman who’s talking ...

Meta did it. Why can’t you?
Eight billion people in the world today, and two billion are already on WhatsApp. A tool that was started for conversations, is becoming the hub ...

Reach your retailers with B2B WhatsApp Engage
Of all the things we need to do daily at work, closing to-do lists have become a constant. May it be a mail or a ...

Pick Up The Fallen Popcorn For Retailers
Bizom B2B WhatsApp Engage takes every business information right into your retailer’s WhatsApp chat box.
When Now Is Not The Right Time
Bizom’s Sales & Operational Planning (S&OP) tool makes this possible and ensures your team doesn’t just do things, but they do it right.

Unknown > Unable
Our midnight food cravings always bring up the same question - “Will I be ok if I ate at this hour?” But has that ever ...

Eleftheria i thanatos
We talk a lot about how India got its Independence. But have you wondered how India lost independence in the first place?

Take a cue from people who drive you
Step into the life of a driver who works for multiple companies like Uber. We all know how they simultaneously juggle bookings across different platforms ...

Experience eCommerce’s Network Capital
This simple hack lets owners gain a higher rating without even making any food! And when the deliveryman comes to take the order, he picks ...

Why Throwing Rocks Isn’t Getting You Water
Let’s start with the story we’ve all probably heard before. A thirsty crow smartly got water from the bottom of a pitcher by filling it ...

How Local Shops Win At Indian Retail
We mostly don’t even know the name of the shops or shopkeepers in our locality. But have you noticed that these shops probably have the ...

The Price You Pay For Emptiness
If an empty mind is a devil’s workshop, an empty business could be your failure’s hideout.

Digital India’s New Retail Revolution
How many eCommerce stores have you visited in your life? 90? 900? India has over 19000 eCommerce stores.
Beetroot Chips & The Biggest Market Bridge
Some things just exist to make us realize how far we’ve come. Beetroot chips are probably one like that.

Hack Your Report Card!
Some of our classmates always knew exactly how much they would get after a maths exam. The ones who would write their answers on the ...

Why Your Friend’s Parents Matter
Let’s be honest. We never really knew their names, but they dominated our happiness.

The Elixir To Execution Excellence
Retail is a team sport. The ideas and performance of each participant matter.

Change To Win
The secret sauce to higher Route-to-Market (RTM) performance isn’t doing more things that increase your efforts.

Re-thinking Retail For The Metail Economy
Who holds the reins of a business?

Rupturing Reliability Or Driving Desire?
It’s becoming a double-edged sword for retail: omnipresence.

Save Your Products From Turning Into A Jolochip
Save Your Products From Turning Into A Jolochip July 7, 2022 | 01 min read Share: Share on twitter Share on linkedin Share on facebook Share ...

The Etail Reality: A penny earned or a pound lost?
The post-purchase reaction phase has undergone a severe change since eCommerce began.

How A Sellotape Is Taking Billions To The Drain
Ten years ago, feeling hungry at an odd hour only led to midnight cooking and crazy hunger pangs.

The Intelligence That’s Steering Retail Ahead
Like water, distribution flows downstream with the aim to reach every part of the earth where there is need.

The “Sensemaking” Enabled Sales Approach
While an empty mind is the devil’s workshop, a clogged mind is often Aergia’s (God of Laziness) adobe.

Accelerating The Sales Wagon With Granular Segmentation – The Omnichannel Advantage
How deep do you dive to get your consumer?

Reduce Digital Pollution In Retail With Omni-IN Tech
How many browsers are open on your computer right now? Multiple.

Managing Omnichannel Retail From Your Phone
Managing Omnichannel Retail From Your Phone May 19, 2022 | 01 min read Share: Share on twitter Share on linkedin Share on facebook Share on whatsapp ...

Are Your Products Rolling Like A Football?
In a 90 minute game, the two things that determine the win are how well your team is built and how well they sync.

“Effective Operations Aren’t Strategies” | Bizom CPG Leadership Meet – Mumbai
Anybody who works in retail has surely heard the word “Omnichannel” popping up now and then. “Omnichannel Retail”, “Omnichannel Technologies”, “Trends” and what not.

Being At The Window Of Opportunities: Fast & Flexi Retail
How fast can someone spend 10,000 bucks? Probably a few minutes, or a few hours, or days. Or they can do all three. And all ...

From Boomers To Zoomers: Binding Product RTMs
The 90s kids who were buying chocolates from the nearby shops, are now ordering chocolates online.

Can Expansion Become Retail’s Elixir For Stability?
Every minute we breathe, 266 new consumers are coming into this world. That’s nearly 16 thousand new humans in a day and approximately 140 million ...

The Frustration The Online Consumer Faces Today
What pushes the average consumer to order groceries online?

The Cornerstone For Building Sustainable FMCD Products
What determines the quality of the quality that products provide?

How NOT TO Make E-Invoicing A Headache For Retail
Congratulations! If your company’s yearly turnover has clocked more than 20 crores since 2017-18, you’ve now officially made it to the club of e-invoicing. ...

Tom & Jerry Were Never The Same
One of the first things that come to mind about Tom and Jerry, is probably cheese. That tiny bite of cheese that Jerry was always ...

How to Find the Right Store for Each Product Type
Like every home, every store’s inventory is also different. And these inventories feed the homes of millions of consumers.

Are We the Blind Who Are Leading the Blind?
Information tends to be both liberating and chaotic. A single piece of information can get tangled and reshaped by the time it reaches the final ...

From India to Africa, here’s what FMCG needs to fix!
Consumers aren’t the only ones moving the sales engine, but are merely a part of the downstream trade mix. From distributors to retailers, when a ...

Make March Merry With FMCG Marketing Optimization Tool
Light travels faster than sound, which is why data travels faster than words. Insightful data can reach the eyes of the right decision-maker DAYS before ...

Surviving The Share Of Stomach
The sensational “badam badam” song that’s sprawling the social web and the subconscious of the millions who are humming it, coincidentally reveals the underlying reality ...

Tapping Into India’s Blueprint For 100 Years Of Retail
Since last Tuesday, when the news hit the streets, most people have been saying the same thing - How Budget 2022 will impact Indian retail. ...

Supply Chain Hack From Kitchen Racks
How many utensils do you have at home? And how many among them do you use?

Where Are FMCG Consumers Going?
Have you stepped out of your home recently? Where have you been? Is it the supermarket or the super-near retail store?

Connecting The Totem Pole Of FMCG Supply Chain
Have you ever jumped over an edge for a good view? If you have, you’d know that it’s not about ensuring that you cross over. ...

The Best Bet To Tackle The 2022 GST Rules & Empower AfCFTA
The new year is here, but India’s fashion streets are yet to be decked up with the best trends. The reason? Not Covid, but GST.

What Does Ambition Mean To You?
It’s most probably not the same as it meant ten years ago to you. And when you think about it, the meaning of ambition changes ...

Can Retailers Directly Go Digital With FMCG Brands?
“FMCG brands have been naughty, causing price disparity”, so says the distributor Santas. Fighting the struggle to keep pace with the pandemic, a large number ...

Can CPG Brands Drive Higher ROI On Trade Promotions?
Where does all the marketing bucks go? Probably on reaching and informing all prospective buyers of lucrative products & offers. But does that always do ...

Retail Hack For Mastering The FMCG Promotion Mix
At the nexus of every successful product promotion lies many promotional strategies, devised to shower heaps of revenue and masses of consumers for retail brands.

How FMCG Brands Can Save Their Partners’ Time
What’s the one thing most businesses struggle to master? It’s not finding customers, making money or handling people. It’s managing time.

Claiming Control Over Claims To Build Relationships
In a home, it’s not about the money you make. But rather about how you manage money to take care of others living with you. ...

Building An Intelligent Claims Management System
To make money in business, you gotta put in money every step of the way. Whether it's production, manpower or sales and marketing, all require ...

Employee Claims Management In The “New Normal”
Claims Management, which primarily tracks the expenses made by on-field employees, is now becoming an essential part of employee management in 2021. Here’s why.

Don’t Make Retailers Wait In This WhatsApp Age
FMCG customers buying from kiranas have a much shorter patience level than online shoppers when making a purchase. An online surfer will take the time ...

Removing Retail Leakage
If you head out to buy a bag of chips in an Indian city, there’s a high chance you’ll come across at least 5 brands ...

Hit “Play” for Purpose: Oiling the Sales Engine
How long does a sales rep last in the field? Industry statistics say it’s roughly 18 months. Feet on street is not the most fun ...

Gamify Retail Distribution for Greater Results
Probably the toughest part about being Spiderman is being consistent with performance and attendance. Waking up every day to save the world at the right ...
Empower Your Salesmen To Sell More Product Lines, Every Single Time!
Sitting in a 4X4 room with hundreds of products, created with multiple variations like size, flavour, a retailer stills know exactly what to give when ...

Smart Shopping for FMCG Retailers
Living in this 24-hour world, we are all spoilt with over 20-25 options for each and every product. May it be toothpaste we use ...

Making FMCG Encash The Festive Feast
30 days of September, and all the way till December, India is officially feeling the festive fever. Commercial places like malls, pubs, bars and restaurants ...

5 Ways FMCG Benefits by Using Intelligent Auto Replenishment System (ARS) for Distributors
5 Ways FMCG Benefits by Using Intelligent Auto Replenishment System (ARS) for Distributors September 9, 2021 | 01 min read Share: Share on twitter Share on ...

How WhatsApp Can Build a Stronger Supply Chain
When 2021 began, a survey asked shoppers if they still wanted to shop at regular stores after experiencing the ease and convenience of doorstep delivery ...

Buy Now Pay Later for SME Buyers is a ‘Must Have’ for FMCG today
Buy Now Pay Later for SME Buyers is a ‘Must Have’ for FMCG today August 23, 2021 | 01 min read Share: Share on twitter Share ...

Enabling “Pay Later” for FMCG Sellers
Enabling “Pay Later” for FMCG Sellers August 19, 2021 | 01 min read Share: Share on twitter Share on linkedin Share on facebook Share on whatsapp ...

Leveraging Conversational Commerce for FMCG
Today, every consumer is spoilt for choices. Making the cut to enter the consumer’s shopping basket takes a whole lot of effort and a well-executed ...

Now FMCG Sells on Whatsapp
The performance of an FMCG product rests on its reach in the market. The best chocolates, chips and cold drinks that we savour are not ...

Why do All Supermarkets Look Alike?
The Sun is there. Night and day, all the same. Sometimes hidden behind the clouds or shadowed by the pouring rain. But always there, going ...

Whisky’s lesson for FMCG companies
Hi, I'm Whisky. For arranging my birthday party (which I hosted at the last minute), I visited some wine shops nearby. As we all know, ...

Answering the Unasked, Awkward Questions of Every Sales Manager
Profitability is questioned and measured at every bend in the business. The sales of the day, the best and worst-performing regions, the market that’s ready ...

The effect of ILWOO’s coffee date & what Netflix can teach FMCG
Ilwoo is a guy you might never have heard of. But Ilwoo did something that made the world go gaga last year. Jung Il-woo, is ...

This Tech can Solve Your Toughest People Management Issues
The initial investment to create a business is made up of people, capital, and maybe land or technology. But over the years, almost everything depreciates. ...

Help Becky find the Biscuits!
Becky hasn’t been able to find her favourite biscuits since the COVID-19 pandemic. She looked for them in several stores futilely. Sounds familiar?

When should FMCG Brands choose Vitamin D?
Digital Transformation is key to getting Data insights for deeper Retail Penetration. The digital divide in retail is widening now more than ever. The downpour ...
Restoring Retail – A Smart Way to Increase Retail Sales as Markets Open
As we reach mid-year, tiptoeing our way while expecting the worst, a new dawn just might set in the context of the Indian CPG market. ...

Advantage CPG Biz: Tap the Liquid Gold of Supply Chain Financing
Rural markets are leading the growth of retail in most developing nations. However, in the second wave of COVID-19, the future seems wary as the ...

Will Gen Zers Single-Handedly Grow the Last-Mile Delivery Market by $6 Billion?
A couple of weeks ago, I placed an order on Big Basket. Instead of giving me the delivery time options, it gave me a token ...

Control Your Markets Masterfully with the Right Retail Analytics
Control Your Markets Masterfully with the Right Retail Analytics May 27, 2021 | 01 min read Share: Share on twitter Share on linkedin Share on facebook ...

3 Capabilities That Are Making Middle East Retailers Massively Successful!
3 Capabilities That Are Making Middle East Retailers Massively Successful! May 20, 2021 | 01 min read Share: Share on twitter Share on linkedin Share on ...

Top 5 Unbeatable CPG Categories of Ramadan & Making Digital Transformation Easy
Top 5 Unbeatable CPG Categories of Ramadan & Making Digital Transformation Easy May 12, 2021 | 01 min read Share: Share on twitter Share on linkedin ...

COVID-19 Resource: Find Open & Stocked Pharmacies
COVID-19 Resource: Find Open & Stocked Pharmacies May 6, 2021 | 01 min read Share: Share on twitter Share on linkedin Share on facebook Share on ...

The Higher Call of Caring for Our People
The Higher Call of Caring for Our People April 29, 2021 | 01 min read Share: Share on twitter Share on linkedin Share on facebook Share ...


It’s Not a Lockdown if We Don’t Call it One
Bizom's data shows no fall in the performance of CPG categories. If it does, how can your business cope?

Accelerate Your Rural Market Expansion in Emerging Economies
Technology enables brands to execute remote retail execution with various tools and, most importantly, by providing access to data and intelligence. CPG brands use mobility ...

4 Trends That Will Shape CPG in 2022
The one challenge that’s worrying CPG brands the most is their outlet coverage. The pandemic has dented their outlet universes, and they are unsure of ...

Is Your Business eRTM Ready?
Last year, the business landscape evolved, and so did the execution models. It became evident that D2C powered by B2B eCommerce Marketplace is the future ...

Fire Up Your Sales With These Summer Trends
Fire Up Your Sales With These Summer Trends March 17, 2021 | 01 min read Share: Share on twitter Share on linkedin Share on facebook Share ...

Double Your FMCG Brand Sales in ONE Year With This Roadmap
Double Your FMCG Brand Sales in ONE Year With This Roadmap March 12, 2021 | 01 min read Share: Share on twitter Share on linkedin Share ...

Top 10 CPG Market & Tech Insights Stories of February 2021
Top 10 CPG Market & Tech Insights Stories of February 2021 March 6, 2021 | 01 min read Share: Share on twitter Share on linkedin Share ...

When CPG Categories & Kiranas Moved Faster Than Ever
When CPG Categories & Kiranas Moved Faster Than Ever February 26, 2021 | 01 min read Share: Share on twitter Share on linkedin Share on facebook ...

RTM Lessons from India’s Insurgent Brands
RTM Lessons from India’s Insurgent Brands February 19, 2021 | 01 min read Share: Share on twitter Share on linkedin Share on facebook Share on whatsapp ...
Top 10 CPG Market & Tech Insights Stories of January 2021
Top 10 CPG Market & Tech Insights Stories of January 2021 February 13, 2021 | 01 min read Share: Share on twitter Share on linkedin Share ...

4 Steps to Set Up & Grow a B2B eCommerce Channel
4 Steps to Set Up & Grow a B2B eCommerce Channel February 5, 2021 | 01 min read Share: Share on twitter Share on linkedin Share ...

6 Steps for a Successful DMS Implementation
Can you deploy your DMS in less than 8 weeks? You can. Here are the milestones and best practices to do it successfully.

Sebamed’s Coup & 5 Must-Haves for Mid-Market CPG Brands
Sebamed’s Coup & 5 Must-Haves for Mid-Market CPG Brands January 18, 2021 | 01 min read Share: Share on twitter Share on linkedin Share on facebook ...

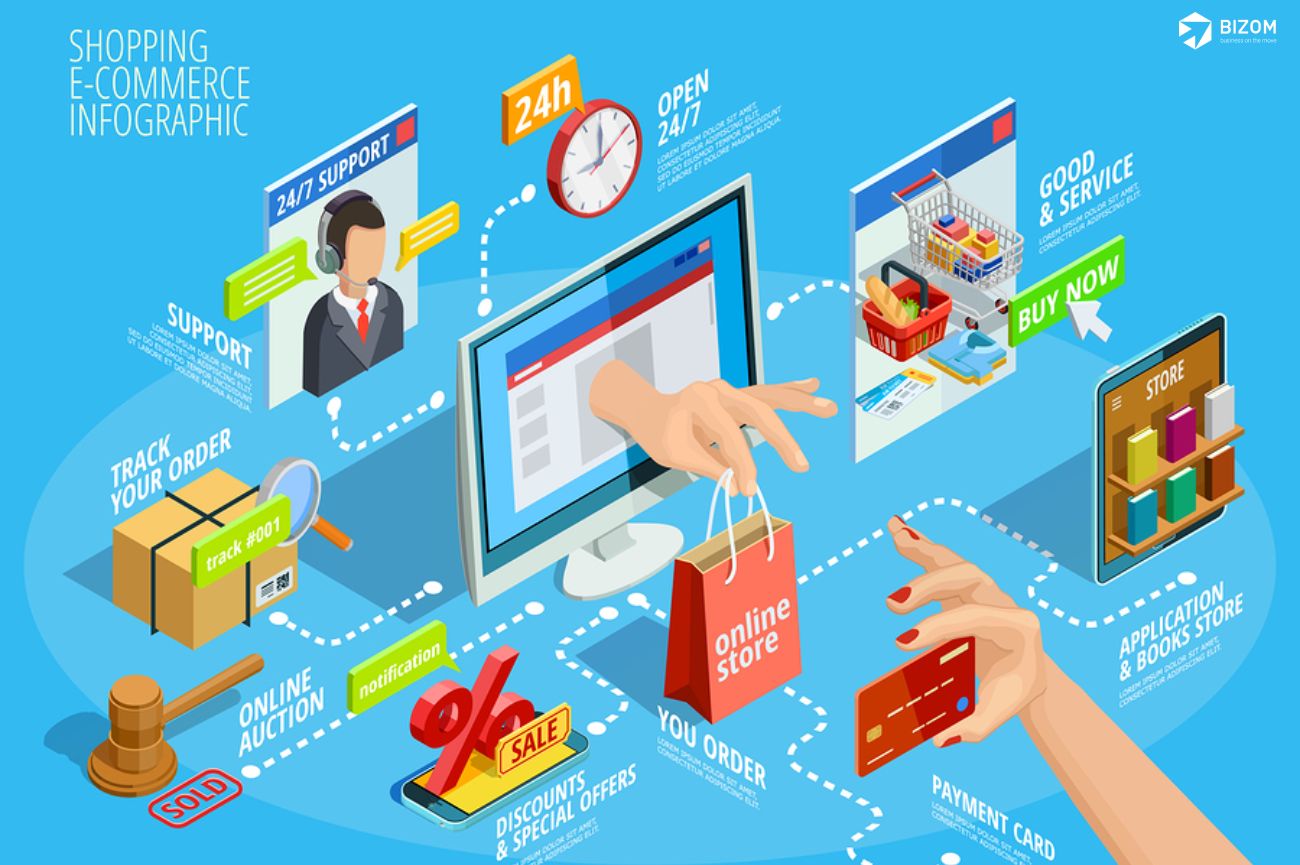
Infographic: The Impact of Automating Your Route-to-Market
Infographic: The Impact of Automating Your Route-to-Market January 11, 2021 | 01 min read Share: Share on twitter Share on linkedin Share on facebook Share on ...
10 CPG Market & Tech Insights Stories of 2020 to Not Miss
10 CPG Market & Tech Insights Stories of 2020 to Not Miss December 21, 2020 | 01 min read Share: Share on twitter Share on linkedin ...

CPG Categories Defy Expectations in Road to Recovery & CPG India Report
CPG Categories Defy Expectations in Road to Recovery & CPG India Report December 9, 2020 | 01 min read Share: Share on twitter Share on linkedin ...

Top 5 RTM Strategies of 2020
Top 5 RTM Strategies of 2020 December 2, 2020 | 01 min read Share: Share on twitter Share on linkedin Share on facebook Share on whatsapp ...

8 Category Trends to Drive Away the Economic Blues
8 Category Trends to Drive Away the Economic Blues November 25, 2020 | 01 min read Share: Share on twitter Share on linkedin Share on facebook ...


5 Reasons to Make B2B eCommerce Your Primary Channel
5 Reasons to Make B2B eCommerce Your Primary Channel November 5, 2020 | 01 min read Share: Share on twitter Share on linkedin Share on facebook ...

India Kirana Report-Sep 2020 & Top CPG Market Research Stories Everyone is Loving
India Kirana Report-Sep 2020 & Top CPG Market Research Stories Everyone is Loving October 29, 2020 | 01 min read Share: Share on twitter Share on ...

Is IPL bigger than Diwali for FMCG?
Is IPL bigger than Diwali for FMCG? October 22, 2020 | 01 min read Share: Share on twitter Share on linkedin Share on facebook Share on ...
Demand & Transacting Outlets Hit 8-month High of 95%
Demand & Transacting Outlets Hit 8-month High of 95% October 15, 2020 | 01 min read Share: Share on twitter Share on linkedin Share on facebook ...

Chocolates vs. Lipstick Index & Building an IPL-like Data Analytics Organisation
Chocolates vs. Lipstick Index & Building an IPL-like Data Analytics Organisation October 1, 2020 | 01 min read Share: Share on twitter Share on linkedin Share ...

5 Wicked Facts About FMCG Categories That Bucked The Trend During Lockdown
5 Wicked Facts About FMCG Categories That Bucked The Trend During Lockdown

3 Predictions About Consumer Spend That Are Rubbish & How To Counter Them
3 Predictions About Consumer Spend That Are Rubbish & How To Counter Them September 17, 2020 | 01 min read Share: Share on twitter Share on ...

Sales gamification lessons from Dhoni during IPL
Sales gamification lessons from Dhoni during IPL September 10, 2020 | 01 min read Share: Share on twitter Share on linkedin Share on facebook Share on ...

6 IPL route-to-market strategies that can accelerate your sales and marketing efforts
6 IPL route-to-market strategies that can accelerate your sales and marketing efforts September 3, 2020 | 01 min read Share: Share on twitter Share on linkedin ...

How Did Kirana Stores Perform in July 2020?
How Did Kirana Stores Perform in July 2020? August 27, 2020 | 01 min read Share: Share on twitter Share on linkedin Share on facebook Share ...

D2C, B2B, eComm: Trends on what’s working for consumer brands
D2C, B2B, eComm: Trends on what’s working for consumer brands August 20, 2020 | 01 min read Share: Share on twitter Share on linkedin Share on ...

Driving Growth Through RTM Digitisation
Driving Growth Through RTM Digitisation August 13, 2020 | 01 min read Share: Share on twitter Share on linkedin Share on facebook Share on whatsapp We ...

Ditch Nielsen Reports, Act On Real-Time CPG Insights
Ditch Nielsen Reports, Act On Real-Time CPG Insights August 6, 2020 | 01 min read Share: Share on twitter Share on linkedin Share on facebook Share ...

Data Helps 2 Brands Beat the Lockdown with Continuous Product Availability
Data Helps 2 Brands Beat the Lockdown with Continuous Product Availability July 30, 2020 | 01 min read Share: Share on twitter Share on linkedin Share ...

Is it over for consumer brands & China?
Is it over for consumer brands & China? July 23, 2020 | 01 min read Share: Share on twitter Share on linkedin Share on facebook Share ...

Rural Demand Outpaces Urban, HUL & Dabur Concur
Rural Demand Outpaces Urban, HUL & Dabur Concur July 17, 2020 | 01 min read Share: Share on twitter Share on linkedin Share on facebook Share ...

3 New RTM Strategies & 3 Market Trends That All Sales Leaders Should Know
Distributors & stockists, and retailers are moving from fortnightly or monthly replenishment cycles to weekly cycles. This is driven by a range of factors including ...

Bizom Readers Love to Grow Sales; Here is the Data
Bizom Readers Love to Grow Sales; Here is the Data July 2, 2020 | 01 min read Share: Share on twitter Share on linkedin Share on ...

The Atomic Power of a Pull Supply Chain
The Atomic Power of a Pull Supply Chain June 25, 2020 | 01 min read Share: Share on twitter Share on linkedin Share on facebook Share ...

Sales Leaders Share Strategies to Deal with a Downturn
Sales Leaders Share Strategies to Deal with a Downturn June 18, 2020 | 01 min read Share: Share on twitter Share on linkedin Share on facebook ...

Multi-Touch Distribution to Scale Sales & Unilever’s Digital Purpose
Multi-Touch Distribution to Scale Sales & Unilever’s Digital Purpose June 11, 2020 | 01 min read Share: Share on twitter Share on linkedin Share on facebook ...

7 Best Practices To Get Your Retailer To Order Himself
7 Best Practices To Get Your Retailer To Order Himself June 5, 2020 | 01 min read Share: Share on twitter Share on linkedin Share on ...

How to Increase Outlet Width and Depth on a Budget?
How to Increase Outlet Width and Depth on a Budget? May 28, 2020 | 01 min read Share: Share on twitter Share on linkedin Share on ...

5 Steps to Empower Your RTM Sales Organization in the New Normal
5 Steps to Empower Your RTM Sales Organization in the New Normal May 21, 2020 | 01 min read Share: Share on twitter Share on linkedin ...

Local is Already Vocal and Demand is Back
Local is Already Vocal and Demand is Back May 13, 2020 | 01 min read Share: Share on twitter Share on linkedin Share on facebook Share ...

Will Chakna Ride the Coattails of AlcoBev’s Stupendous Sales?
Will Chakna Ride the Coattails of AlcoBev’s Stupendous Sales? May 10, 2020 | 01 min read Share: Share on twitter Share on linkedin Share on facebook ...

Breaking New Ground, One Distribution Myth at a Time
Breaking New Ground, One Distribution Myth at a Time April 30, 2020 | 01 min read Share: Share on twitter Share on linkedin Share on facebook ...
Tracking COVID-19’s Impact on Demand in India During the Lockdown
Tracking COVID-19’s Impact on Demand in India During the Lockdown April 29, 2020 | 01 min read Share: Share on twitter Share on linkedin Share on ...

Climb Out of Your Supply Chain Rock-bottom
Climb Out of Your Supply Chain Rock-bottom April 23, 2020 | 01 min read Share: Share on twitter Share on linkedin Share on facebook Share on ...

Continuous Distribution Runs on the Bizom Retailer App
Continuous Distribution Runs on the Bizom Retailer App April 6, 2020 | 01 min read Share: Share on twitter Share on linkedin Share on facebook Share ...

A View from a Beverage Brand Manager’s Desk Under Quarantine
Over the past few years, it’s been gratifying to see the consumer trend move away from sugary cola drinks to healthy fruit drink brands like ...

FMCG brands need to work from home: In the wake of COVID19
FMCG brands need to work from home: In the wake of COVID19 March 30, 2020 | 01 min read Share: Share on twitter Share on linkedin ...

Bizom Advisory to Brands in the Times of COVID-19
Bizom Advisory to Brands in the Times of COVID-19 March 26, 2020 | 01 min read Share: Share on twitter Share on linkedin Share on facebook ...
What’s Ahead for India’s FMCG
What’s Ahead for India’s FMCG March 12, 2020 | 01 min read Share: Share on twitter Share on linkedin Share on facebook Share on whatsapp It’s ...

Automation Can Kick-start Growth for Floundering FMCG Brands
Automation Can Kick-start Growth for Floundering FMCG Brands October 9, 2019 | 01 min read Share: Share on twitter Share on linkedin Share on facebook Share ...

Secrets of Actionable Insights For Your Business
Whatever the impact of the downturn has been on your brand, as we pointed out in our last newsletter, there is no better time than ...

Are You Prepared for a Slowdown?
Are You Prepared for a Slowdown? August 30, 2019 | 01 min read Share: Share on twitter Share on linkedin Share on facebook Share on whatsapp ...

Message from the Pakistan Cricket Team to FMCG India: “Change is hard, but a must”
Message from the Pakistan Cricket Team to FMCG India: “Change is hard, but a must” August 30, 2019 | 01 min read Share: Share on twitter ...

The Next Big Digital Disruption in FMCG Distribution
The Next Big Digital Disruption in FMCG Distribution March 22, 2023 | 01 min read Share: Share on twitter Share on linkedin Share on facebook Share ...

Bizom Annual Conclave: The Opening Act…
Bizom Annual Conclave: The Opening Act… August 30, 2019 | 01 min read Share: Share on twitter Share on linkedin Share on facebook Share on whatsapp ...

5 Hacks to Elevate Demand Forecasting with Retail Intelligence
5 Hacks to Elevate Demand Forecasting with Retail Intelligence April 16 2024 | 03 min read Share: Share on twitter Share on linkedin Share on facebook Share ...

5 RTM essentials to achieve Retail Brilliance in Saudi Arabia
Decoding consumer sovereignty remains one of the biggest challenges every FMCG business faces even today.

Leverage Dynamic Pricing Strategy for Sustainable Growth
The incorporation of dynamic pricing strategies also serves to streamline pricing processes within FMCG enterprises, thereby reducing manual efforts and operational costs.

The power play conversation to unlock exponential sales
As businesses navigate the ever-evolving landscape of the global market, the role of Route-to-Market (RTM) strategies has become increasingly pivotal in driving sales growth.
Digital Transformation Purpose: Empowering The Human Capital With Intelligence
Purpose is the fuel that ignites progress within people. In business, purpose yields the means to remain competitive, profitable, and aligned with consumer demands.

Unlocking Potential: Benefits of Digital Transformation
Explore how the many benefits of digital transformation helps businesses amplify market potential and performance productivity.

What is Sales Force Automation Tool
Discover the benefits and features of Sales Force Automation Tools.

Modern Trade vs. General Trade: Choosing the Right Retail Strategy
Explore the advantages and challenges of modern trade and general trade for brands.

Exploring 5 Key Differences between Logistics and Distribution Management
Learn how Bizom's comprehensive platform empowers businesses to streamline distribution processes.

How Distribution in the Supply Chain Streamlines Management
Learn how Bizom's comprehensive platform empowers businesses to streamline distribution processes.

What is Merchandising and how does it impact sales?
Merchandising is a crucial component of the retail industry, which makes the connect between products and consumers at first sight.

Distributor Management System | Guide
Discover the intricacies of a Distribution Management System (DMS) and explore its robust features in our comprehensive guide.

Bringing the world’s best RTM tech to Indonesia’s FMCG ecosystem
Read how CPG Leadership Meet Indonesia brought together the biggest leaders in Indonesia.

Smart Merchandising: A Comprehensive Guide for Outlet Management
In the fast-paced world of FMCG, retail shelves can become cluttered with an array of products. This is where Smart Merchandizing or Retail Merchandizing comes ...
5 Essential Things You Need to Know about Distributor Management System
A Distributor Management System is a powerful software solution designed to streamline and optimize the activities of retail distributors.

Decoding The Best Digital Transformation Framework For Sales Success
Adopting a well-defined digital transformation framework gives a structured approach to seize market opportunities.
Top 5 methods to enhance multi-channel eCommerce inventory management
Learn about the 5 top ways to improve multi-channel inventory management for your eCommerce business.
Decoding future trends in distribution and supply chain management
Discover the future trends in distribution and supply chain management.

9 Trade Schemes in FMCG That Can Boost Sales 3X
Explore nine highly effective trade schemes in the FMCG sector that can triple sales, revolutionize growth, and capture a larger market share.

Importance of a strong Distribution Network Analysis for Business Success
Learn about distribution network analysis and its importance in retail business.

7 Critical Tools for Trade Promotion Management Success
Explore tools transforming Trade Promotion Management. Enhance the digital suite and elevate your promotional activities.
Unlocking Data-Driven Insights: 7 Essential Analytics Tools for Distribution Management
Explore 7 analytics tools to optimize distribution management. Boost efficiency and unlock data-driven business insights.
Implementing the 5 Key Components of Merchandise Planning
Learn about the 5 Basic Components of Merchandise Planning in Retail to enhance customer experience and sales.

Top 7 B2B Sales Techniques – Distribution 2.0
Discover the top 7 B2B sales techniques for Distribution 2.0 success. Learn how Bizom’s advanced analytics, personalized messaging, and collaborative selling tools can help drive ...

7 Trending Smart Retail Innovations To Watch Out For In 2023
Learn about the 7 smart retail innovations that are trending in 2023

Unveiling the Potential of FMCG Distribution in Nigeria
With a population of over 200 million and $20 billion economy, FMCG Distribution in Nigeria is a major powerhouse for the country’s growth.

Consumer Behavior Insights: Unlocking the India FMCG Market in 2023
Discover the untapped potential and growth opportunities in the thriving India FMCG market of 2023.

How Sales force Automation Software Enhances Sales and Distribution
Find out how sales force automation (SFA) software boosts distribution efficiency and customer loyalty.

How to rev up your sales engine with optimized RTM strategies – Chai with CPG Leaders: Delhi
A discussion on RTM strategies, Chai with CPG Leaders was held at Delhi, India on the 12th of May 2023. Here are the event highlights.

Top 7 Inventory Management Challenges & Solutions
Learn how to overcome the top 7 inventory management challenges faced by businesses.

Decoding Retail Analytics: The Revolution in Consumer Markets
Discover the role of retail analytics in transformation of consumer markets. Learn how analytics can be used by retailers to personalize customer experience.

Analytics for Retail: The Right Metrics to Use for Your Business
Leverage Retail Data Analytics to enhance decision-making. Select the most relevant retail metrics and KPIs to get real-time customer insights and drive success in your ...
Steps to build a competent Warehouse Management System
Discover the key features and best practices for implementing a powerful Warehouse Management System (WMS) to optimize omnichannel fulfillment.
Choosing The Perfect Distribution Strategy
The following distribution strategy guide will help you learn how to get your products and services in front of your target audience, intelligently and without ...
Top 9 Tools for Effective Warehouse Management
Discover the 9 must-have tools for Warehouse Management System. Learn how businesses can optimize their operations and gain a competitive edge.

The Unique Techniques of Sales & Distribution Management
Discover unique strategies to boost sales and optimize the supply chain through sales team management, goal-setting, channel identification, and more.

Omnichannel Retail: Inception, Strategies & The Future
Read the top omnichannel retail strategies of 2023 by industry experts to unify multiple sales channels and create a single seamless buying journey and an ...

Getting fooled in the name of Retail Visibility?
Retail Visibility is a vital aspect of sales success for FMCG companies, making it possible to drive market actions according to market insights.

Unfolding the power of data-driven decisions at the Detroit of Asia – Chennai
Bizom’s fifth edition of Chai with CPG Leaders transpired in the Detroit of Asia - Chennai.

Habeebi, GCC’s Top FMCG Leaders Met at Bizom’s inaugural Dubai FMCG Leadership Meet
The Vault at JW Marriott Marquis Hotel, Dubai was buzzing with energy as leaders across industries gathered together for Bizom’s inaugural Dubai FMCG Leadership Meet.

The Right RTM strategy helps gain market share – Chai with CPG Leaders: Pune
A discussion on RTM innovations for 2023, Chai with CPG Leaders was held at Hyderabad, India on the 11th of November 2022.

How to increase ground-level productivity and sales efficiency?
Online as well as offline, consumers are truly the king, with every tick of the clock bringing new choices.

Data and India: The Superpower Philips Needs
In this conversation with Bizom, Mr. Vikram Singh and Mr. Varun Bansal from Philips India, talk to our Growth Officer, Akshay Fotedar, on how data ...

Why rely on sales reps to engage with retailers?
We’ve gone from clunky cash registers and being buried under a never-ending pile of paperwork to using a single gadget to sell anywhere.

Unfolding importance of data-driven decisions at the textile hub of India
A discussion on RTM innovations for 2023, Chai with CPG Leaders was held at Hyderabad, India on the 11th of November 2022.

Unfolding CPG’s must-needed RTM innovations in the City of Pearls
A discussion on RTM innovations for 2023, Chai with CPG Leaders was held at Hyderabad, India on the 11th of November 2022. Here are the ...

Strategies that brands can adopt to penetrate Tier-II and III markets
Some things just exist to make us realize how far we’ve come. Beetroot chips are probably one like that.

A sneak peek at Chai with CPG Leaders – Kolkata
Bizom’s first Chai with CPG Leaders Meet commenced at “the City of Joy”, Kolkata.
Retail Automation: Meaning, Merits and Market Stories
Retail automation as a whole, acknowledges the journey of a brand across the supply chain to connect every touchpoint and collect the right insights in ...

Bizom CPG Leadership Meet 2022 – Bangalore
The final chapter of Bizom CPG Leadership Meet 2022 brought together two brilliant leaders from United Breweries and Emami Agrotech, who shared their struggles and ...

Bizom CPG Leadership Meet 2022 – Delhi
What happens when the most significant leaders of India’s retail industry meet and discuss the future of their businesses?
Bizom CPG Leadership Meet 2022 – Mumbai
The evening with CPG leaders commenced with an opening note by Rama Bijapurkar.

Super Sales Sunglasses For Your Super Sales Team
Having your eyes on the market is the best way to know what's happening. Imagine seeing the market through the eyes of your sales team.
Budget 2022 Strengthens The Long Term Foundations For Indian FMCG
We live in a world where a wave isn’t necessarily the ocean wave that helps calm the mind and kindles fond memories.

New Worries for FMCG to Sell Online
When the gamble goes wrong, it’s learning. When it’s right, it becomes a quick hack for earning. That’s precisely what most businesses are doing today. ...

TDS under section 194Q of the Income-tax Act, 1961
With the introduction of section 194Q of the Income-tax Act, TDS or Tax Deducted at Source was implemented for the 1st time, on the purchase ...
Opportunities for Growth in the New Normal
The last year or so has been a blessing in disguise for many consumer goods companies.

Jo dikhta hai, woh bikta hai – But how can Indian Kirana stores achieve this?
The Internet has turned our existence upside down. It has revolutionized communications to the extent that it is now our preferred medium of everyday communication. ...

8 Retail Merchandising Strategies to shore up Consumer Product Sales
Digital Transformation is key to getting Data insights for deeper Retail Penetration.

Recover Market Share in 2021 with these 3 Retail Strategies
Here are some key strategies that FMCG companies must focus on over the coming months.
How FMCG brands can drive Business Growth using the Ansoff Matrix and Bizom
With Bizom, brands can get those data points anytime from anywhere making it easier for them to make accurate decisions.

3 CPG Recovery Strategies That Can Enable a Revenue Breakthrough in June
Bizom platform provides a plethora of solution options catering specifically to the problem the client is looking to solve.

How to Avoid Channel Conflicts with a Powerful Omnichannel D2R2C Strategy
Considering our CPG customer’s preferences, Bizom got in the space to solve consumer problems.

Can AI replace FMCG salesmen?
Technology is changing our lives daily and it is just a matter of time before every single job in the world will completely evolve.

Will FMCG Defy Lockdown Woes? Our Data Says, “Yes!”
Here’s a chart to give perspective as to how we can expect to see demand panning out across product categories in Q1FY2122.

Basics of Retail Execution and How to Get It Right Every Time
For people from the FMCG industry, ‘retail execution’ is akin to breathing. But what exactly is FMCG Retail Execution?

Addressing the Challenges of Competing in a Data-driven World
Data and analytics are revolutionizing the CPG industry, and the impact will be deeper with increased adoption.

Omnichannel to Deliver a Seamless Experience for Your Customers
Bizom’s integrated platform can help brands optimize their RTM strategies for omnichannel commerce.

4 Supply Chain Questions to Ask in 2021
Brands that have successfully transformed their supply chain address four key challenges.

Focused Outlet Service and Coverage Yields Better Results
Without access to demand insights, the sales team often operates on a coverage model that is not aware of the gaps in stock or demand.

How to Identify the Right Outlets to Sell More the Hersheys Way
The brand identified the right outlets with Bizom’s sales automation tool and was able to measure the potential of individual outlets.

Will Indian Bathing Soaps Finally Care for the Skin
At Bizom, we surveyed on LinkedIn to gauge public perception of the Sebamed advertisements.

Winning digitisation suite for a growing brand
The ability of mid-market brands to execute an integrated RTM strategy at speed is paramount to their success.

3 CPG Growth Trends That Won’t Change in 2021
The most popular changes are the increased automation of supply chains and a greater reliance on data and analytics.

Would You do a Money Heist?
With a whole lot of us confined to our homes in 2020, I hope you have had the opportunity to enjoy this series.

Do Month-end Sales Push to General Trade Help Consumer Brands Gain Incremental Sales?
Dum laga ke haisha. Zor laga ke haisha…Jeetenge hum…haisha

4 Best Practices for a Category Manager
Here are four best practices that can aid all category managers to analyse your category performance.

FMCG distribution is being taken over by them…
Priorities of a generation born in modern India are changing rapidly, leading to high attrition of distributors who are getting increasingly difficult to replace.

JioMart B2B Commerce – A pie in the sky or a game of thrones for consumer goods “ecosystem”?
JioMart as a channel not only disrupts traditional distributors but also caters to the same retailers that the traditional distributors cater to.

Move over Lipstick Index, it’s the Chocolate Index that drives us Indians!
Chocolates do provide comfort to Indian consumers in challenging times and we’ve happily consumed them to keep our minds focussed on the good things in ...
How to Get Retailers to Order From the Bizom Retailer App
Start with our Retailer App, which enables retailers to place their orders on the app and track their delivery.

IPL, Analytics & Insights: How CPG Brands Can Leverage Their Data?
If you wish to maintain or even enhance the motivation of your workforce, you can link automation to incentives.

How to Reduce Costs & Increase Cash Flow for Distributors with an Auto Replenishment System
Auto Replenishment System is an inventory management process which helps in maintaining the desired levels of inventory at the customer end.

5 reasons why JioMart will put a stop to the Reliance juggernaut
The Reliance juggernaut seems unstoppable today. Jio's win of the telecom war was both unprecedented and spectacular.

Hey Sales Leader! Here’s how and why Dhoni would have gamified your distribution teams, this IPL season
We at Mobisy have always thought of our friends at sales and distribution teams in consumer brands using Bizom.

Secrets of Gaining Market-share by Building a Retailer Self-ordering Platform
Let’s begin by emphasizing that no half-hearted attempts at experimentation with technology will cut it.

Increasing outlet coverage in COVID-19 times
Brand Basmati streamlined sales operations, increased outlet coverage and field sales force productivity by leveraging Bizom’s digital solutions and retail intelligence platform.

Navigating the Icarus Paradox for Long Tail Business Strategy
The costs or the size of the channel come into play and curtails the aspirations for fledgling organizations.

How to Engage a Technology Partner to Kickstart Your RTM Digitisation Journey?
Starting with the delivery methodology, here are some fundamental tenets and approaches that your technology partner should follow and bring to the table.

8 Ways How The Rules of Availability Are Changing
To ensure you don’t get caught again, here are some things to ensure that tumhara product ‘Dikhega aur bikhega’.

COVID-19: 3 Passing Fads You Should Ignore
Here are some of my thoughts. I understand some of you will agree, and some of you won’t.

Best practices to increase retailer adoption for self ordering
The challenge was to increase sales by 300% in one year. How did I do it?

3 Steps to Execute Multi-Touch and Grab the Missed Sales
3 steps and you will have your entire universe and more to drive the sales growth you aspire to and our brands already see.

How brands have to redefine their pull strategy for the new normal
Is it time to relook at distribution strategies and redefine the scope of push vs. pull distribution?

3 Step Approach to More Productive Sales Teams
It’s about scaling your customer engagements exponentially through a range of digital touchpoints and embedding technology in your supply chains.

Become Value Conscious, Not Cost Conscious
The times have changed and the new normal means more focus on cutting costs across organizations.

How CPG brands need to pivot their RTM organisations in the new (ab)normal?
As lockdowns start to ease up, business leaders need to act now on what changes they will have to do to ensure smooth business operations ...

Direct to Consumer is Direct to Retailers in Emerging Markets
Now that unit economics is out of the way, let's find out how this solution works.

What’s Ahead for the Kirana Store?
In the worst days of the lockdown, it was the kirana store that ensured a continuous supply of essential goods.

Helping Supply Chains Embrace the New Normal
The partnership between Bizom and Yellow Messenger will enable consumers and retailers to order directly from the brand through WhatsApp.

Webinar: Ensuring Product Availability in Times of Lockdown
Understand the importance of channelling their distribution efforts where it matters the most and they take quick decisions.

Driving B2B Sales Growth Through RTM Innovation
Bizom’s retail intelligence platform enables brands to drive effective distribution strategies through a range of AI & digital capabilities.

Be more available. Coexist smarter.
It is an opportunity to learn how our technology is helping out brands and even more so when times are difficult.

Secure your business engagement during a lockdown
How can we stay connected, especially when everyone is confined to their homes.

How can Consumer Businesses handle COVID-19
As the world braces for the worst, businesses are desperately turning to technology.

How is India consuming and brands realigning their distribution in COVID-19 times?
Watch the InstaLive of the discussion between Vishal Krishna and Lalit Bhise.

How to ensure a continuous supply chain for your General Trade sales organization?
Here’s where communication with all channel partners as well as outlets plays a considerable role.
How Brands can Ensure Business Continuity with Direct Retailer Engagement
Why then, in a world where engaging directly with consumers is not just possible but essential, are brands still content with keeping their retailers –the ...

Key FMCG Trends for 2020
Technology has been a critical driver of change for FMCG companies, and 2020 may see them ramping up their technological transformation.

6 Steps for FMCG companies to Conquer New Territories
Today brands need to build a team capable of adopting and leveraging the capabilities of tech tools to derive greater success and conquer new territories ...

How to Stay Ahead of the Top FMCG Trends for 2019
This article tells you towards a couple of the best predictions out there and help you figure out how you can future-proof your consumer brand ...

What to Expect When You’re Distributing!
If you think the technology is working for us, make it work better, If you think that the technology isn’t working for us, then you ...

How we can help you get closer to the consumer!
The consumer is probably the most important word in ‘Consumer Product Goods’ or CPG companies and it has never been more true than today.

May the Force be With You! How Going Digital is Necessary to Propel Your Business into the Next Orbit of Growth
In this blog we found how digital is the force that helps you overcome gravity to then move to the next orbit of growth.

Will Automation Make the FMCG Industry’s Sales Force Obsolete?
This is a question Mobisy’s CEO Lalit Bhise often faces when he takes the company’s flagship product Bizom.

Carpe Diem! 3 Hacks to Help FMCG Sales Folks Become More Productive
Simple hacks have helped Bizom’s customers increase their sales force’s productivity by 70% and more.

Only the Paranoid Thrive, in Indian FMCG!
Without more blabber, here are some touchy sales and distribution moments knocking on the doors of today’s business leaders.
The Quiet Revolution Happening in FMCG Retail Supply Right Now
Why are these top names in retail suddenly turning their focus to B2B order fulfilment

Seasonality in FMCG consumption trends in India
Here we look at some insights about the “seasons” that impact FMCG sales in India.

Three Metrics that Show How a Top FMCG Company Used Secondary Sales Insights to Drive 2X Growth
We hope to soon bring you a complete account of this company’s inspiring story of driving business outcomes through automation...

3 Strategies to Win The War for India’s Kirana Market
3 Strategies to Win The War for India’s Kirana Market March 15, 2018 | 03 min read Share: Share on twitter Share on linkedin Share on ...

Opinion: What Salesforce gets wrong about the CPG industry in emerging markets
Opinion: What Salesforce gets wrong about the CPG industry in emerging markets March 14, 2018 | 08 min read Share: Share on twitter Share on linkedin ...
How FMCG Brands Can Tap Into the Growing Middle Class & Affluent Consumer Market
How FMCG Brands Can Tap Into the Growing Middle Class & Affluent Consumer Market March 1, 2018 | 02 min read Share: Share on twitter Share ...

8 Key Things to Look for while Evaluating a Sales Force Automation Vendor | Free RFP Checklist Included
Choosing the right sales force automation solution for your business is a delicate and unforgiving task.

The Holy Trinity for Digital Transformation Success
Digital transformation has become the compass guiding organizations through the unknown and towards unprecedented heights.

Transforming Consumer Packaged Goods: The Impact of Generative AI on the CPG Industry
In an era defined by rapid technological advancements, the Consumer Packaged Goods (CPG) industry is experiencing a paradigm shift with the integration of Generative Artificial ...

Unleashing the power of Sales Force Automation tools
In the ever-evolving landscape of business, staying competitive requires businesses to be agile, efficient, and customer-centric.

Is GenAI all Fart and No Sh*% ???
In the fast-paced world of Fast-Moving Consumer Goods (FMCG), staying ahead of the curve is crucial for success.

Navigating the Challenges of Joining ONDC
The idea of ONDC was conceived to support entrepreneurs at the grass-root level and digitize local retailers.

Streamline Your Field Operations with the Power of Field Force Automation Software
Explore the benefits of Field Force Automation Software and how it can transform your field operations to drive growth and success.

Stock Replenishment: 5 Tips and Tricks to Omit Out of Stocks
Learn 5 easy stock replenishment tips and tricks to prevent stockouts and better meet client needs.

Master the Art of Assortment Optimization: Boost Sales and Delight Your Customers
Boost retail sales and elevate customer satisfaction with assortment optimization.

Optimizing Retail Assortment Planning: Top 5 Tactics for Effective Product Placement
Master assortment planning by understanding customer demographics, leveraging data analytics, and using Bizom for enhanced retail success

Choosing Retail Analytics Software Based on KPIs
Which retail analytics software suits your business needs? Here are 10 essential KPIs that can help you better choose your software for your retail needs. ...

A Detailed Overview of Warehouse Management Systems and How They Work
In this article, we’re covering everything you need to know about a warehouse management system for small business including their key characteristics and benefits of ...

Retail Analytics Market Analysis– Industry-Specific Opportunities and Trends Affecting the Growth
The latest retail analytics market Trends and in-depth analysis for profit Maximization & optimized retail ecosystem

Mastering Supply Chains with Retail Intelligence: A Comprehensive Guide
Learn how retail intelligence is revolutionizing the retail industry, optimizing supply chain processes, and increasing profitability for retailers with Bizom.

Driving Supply Chain Optimization through Distribution Automation
Discover how automation optimizes supply chains, reduces costs, and improves customer satisfaction. Learn how Bizom can help.
From Chaos to Control: The Power of Inventory Management Software
Learn how inventory management software can help businesses improve accuracy, save costs, and enhance customer experience.

Harness the Power of Retail Data
Allows organizations to avoid costly errors such as incorrect information on customer records.
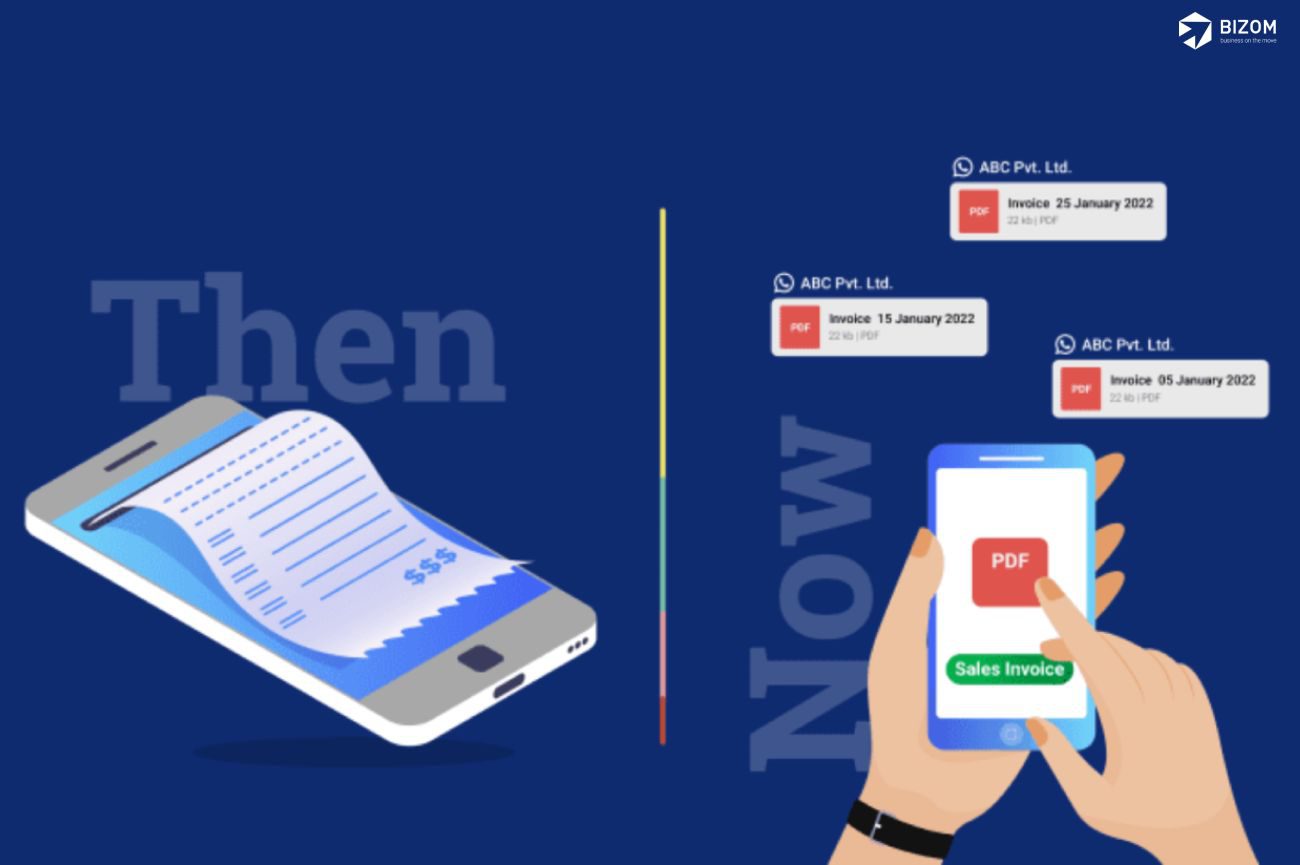
Move from the sales invoicing hassle and automate it through B2B WhatsApp Engage
You, your team and even the boss - everybody wants data. Yet nobody knows the best way to get it. So the search continues.

Give Offline Sellers The Online Power
This ONDC starter guide details the steps for consumer product companies to start selling on the ONDC network through Bizom.

How Do Salesmen Sell More With Sales Gamification?
By introducing gamification in sales, the wheel of motivation keeps revolving around the entire sales team daily, turning selling into a game they are playing ...
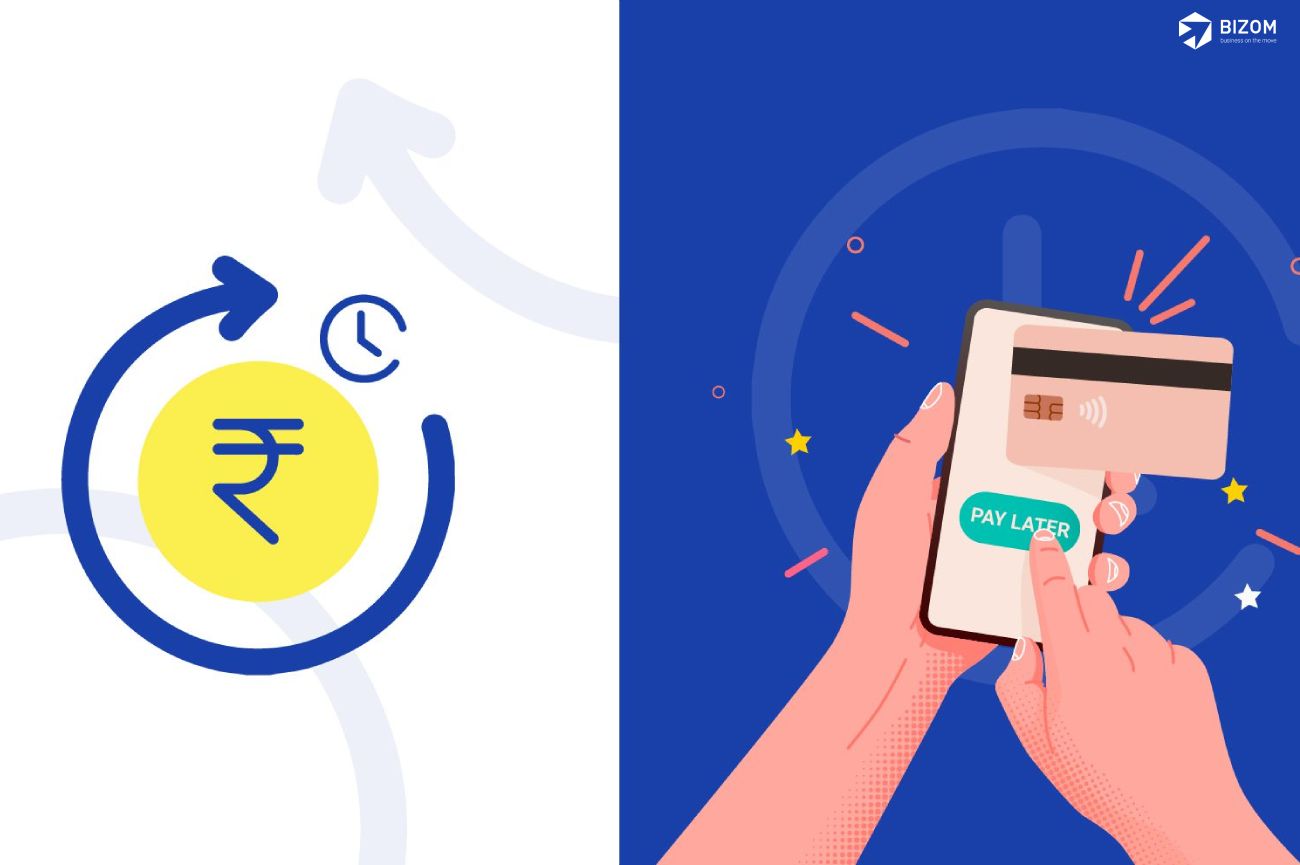
Buy Now Pay Later – All You Need to Know
Results in the stocking of fast-moving products, more sales, better customer loyalty, higher turnover, and higher profits.

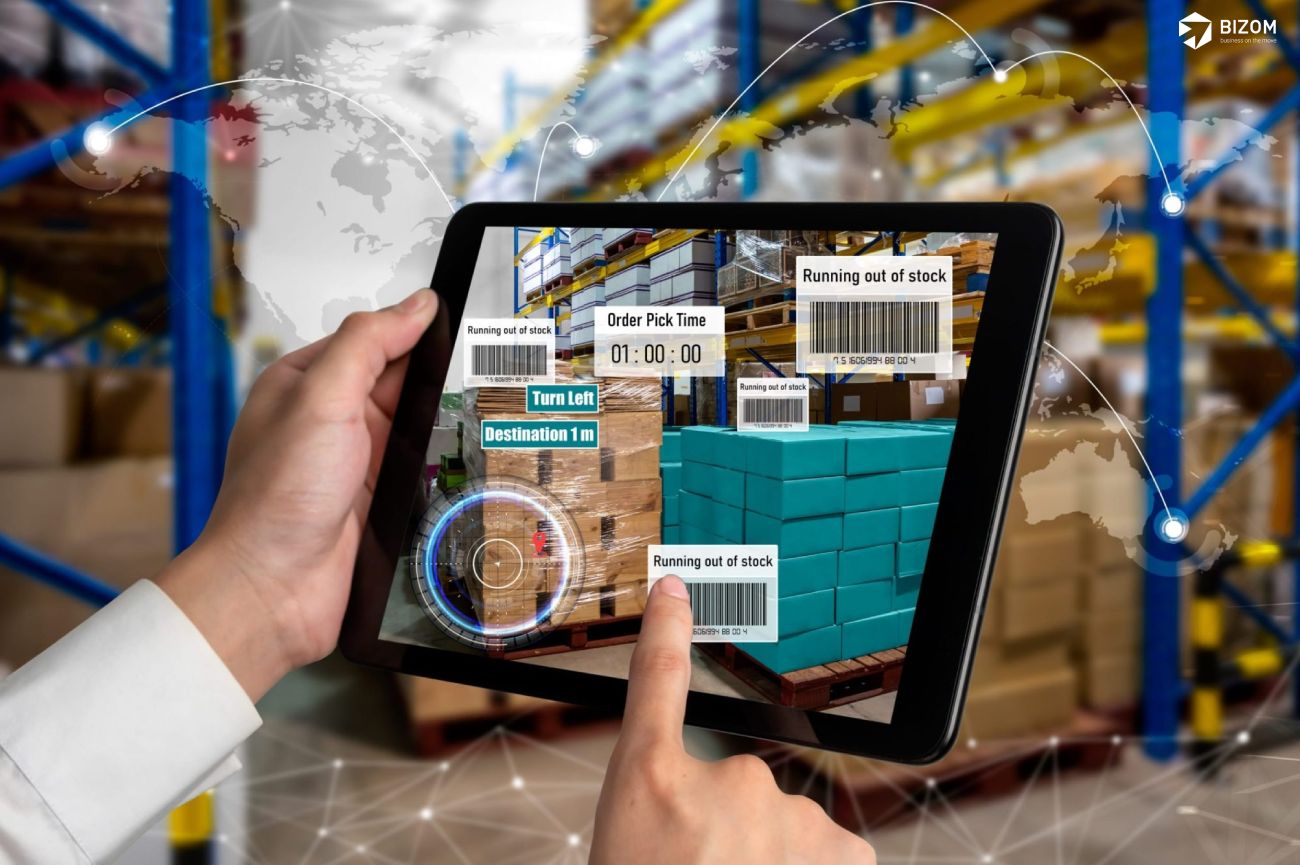
How can retail intelligence grow sales volumes?
550+ leading CPG businesses today, use Bizom as a retail intelligence partner to spearhead growth across geographies.
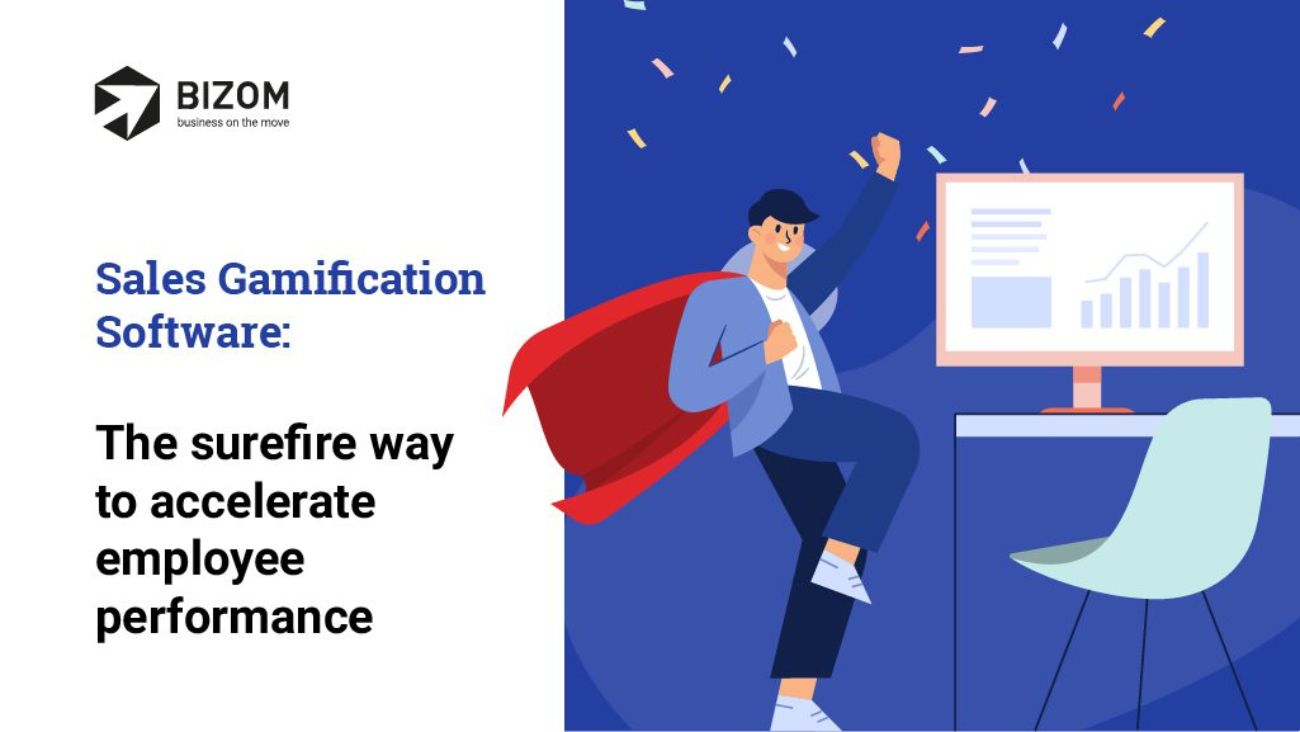
Sales Gamification Software: The surefire way to accelerate employee performance
How you can leverage sales gamification software to help boost your sales team’s performance and keep them highly motivated.

Reorganizing Retail In 2022 With The O2O Business Model – Structure, Benefits & Strategies
The Online-to-Offline (O2O) business model is a business strategy, built as a part of a company’s omnichannel play, to attract consumers to step out of ...

Capture 100% ACCURATE Sales Numbers Intelligently!
Sales managers can monitor the performance of their sales themselves, and make the right decisions at the right time.

Growing Digitally With Data – Shell India’s Digital Transformation Journey
Manifesting even a small change in the supply chain, can be a daunting task. So how does digitally transforming the supply chain look like?

#UpgradeToBizom before 31st Dec and get TPM free for 6 months! Click here to enrol now.
If you have read the blog title and have landed on this page, I believe I have successfully demonstrated the power of good Trade Promotions ...

Benefits of Bizom Distributor Claims Management
Bizom Claims Management helps distributors & brands by generating claims just with a couple of clicks.

Building the FMCG Smart Basket
Smart Basket is a self-learning algorithm that, at the backend, predicts what the retailer is going to order next.

WhatsApp – The Real Marketplace
Whatsapp is no longer just an app, it is a grand marketplace that can help you set up shop inside every house.

Can FMCG be There, When No Network is Near?
Bizom Offline makes it possible for the travelling salesman to travel to any part of the world to grow the business.

Turbocharge sales through effective visual merchandising
Bizom’s Smart Merchandising solution creates customized retail merchandising strategies using this three-fold approach.

How do we Grow? One Store at a Time.
Bizom Market Expansion helps brands to find the right retailers to maximize sales for the product in its sub-category and its price point.

Use One Tool to Track All Teams – Bizom Power2People
Power2People helps consumer brands harness the power of data to get real-time insights into their fingerprints for faster.
4 RTM tools every CPG brand needs to equip their Distributors with, today!
Bizom tools not only improve your RTM efficiency but lets you stand out from the competition and win at the point of sale.

Find My Chemist – Search for Medical Stores near you
With, Find My Chemist, Bizom hopes to help everyone find the right medicine for them, right when they need it.

Transforming the Route to Market for consumer brands, One Innovation at a Time
This one is especially for sales managers who can view dashboards anytime and anywhere without using any mobile application.

Boost Sales with Data-driven Approach to Merchandising at the Shelf
To gain excellence in retail execution, CPG brands are beginning to invest substantive resources in the organization.

5 Solutions Every Mid-Market CPG Brand Needs Right Away
To accelerate your growth and double your revenues YoY as Bizom brands do, you need a larger digital transformation vision.

How to Scale Adoption of Your Digitised Supply Chain in 2021?
The most significant change has been in the digital transformation of the world’s supply chains.
Wanna build a B2B eCommerce marketplace? But can you deliver?
The Bizom team identified this opportunity back in 2016 and even launched our own B2B eCommerce product called Distiman.
How Adversity & Technology were Unibic’s Best Friends to Grow to a ₹500 Crore Company
At UNIBIC, we believe that every problem brings a set of opportunities, and only by acting on them can we emerge successfully.

4 Market Opportunities to Win With a B2B eCommerce Marketplace
How brands can capitalise on the market opportunities with a B2B eCommerce Marketplace
How to Shorten Your Digital Roadmap from 3 Years to 3 Months
If you are in CPG here are three golden rules to keep it simple and give businesses the real business ROI.

Leading dairy brand’s tech focus to transform a traditional business into a value-added products giant
A large part of winning in primary and secondary sales are the discounts and schemes offered to distributors, which were tracked manually earlier.
Stop Reading Nielsen Surveys; Act on Real-Time Insights
Consumer businesses focus on making products and distributing it to the urban masses to drive consumption at scale. Why?

Transforming the Experience and User Interaction of Bizom Multi-Touch Platform
The journey to creating winning Route to Market strategies for the new normal starts with identifying and leveraging.

Infographic: Benefits and Services of Bizom Multi-Touch Platform
At the heart of this platform is our Retailer App, which is ably supported by our Eagle Eye and OneView solutions.

Bizom Multi-touch Platform Can Grow Your Sales Exponentially
Enter the BIZOM MULTI-TOUCH platform that can help you to triple engagements with your customers by leveraging a range of digital TOUCHES.

Perfecting the Retail Intelligence Platform of the future, one update at a time
To deliver a platform for the consumer brand ecosystem that is a single source of truth for distribution in emerging markets.

How to Assure Business Growth with Advanced FMCG Analytics
The game-changer, in this case, is Retail Analytics.
Transforming FMCG Sales and Supply Chain, One Innovation at a Time
Today’s the kind of day that we live for here at Bizom! Today we’re extremely proud and happy to announce the launch of a ...

Beat Optimization for FMCG – The Traveling Salesman Chronicles
“Is the travelling salesman problem an NP-hard or an NP-easy problem?” our CEO asked one of the new R&D employees at Mobisy.
Three Steps to Sales Transformation – Through Bizom’s ELL
FMCG brands can build “Perfect Stores” through Bizom’s retailer app which allows retailers to order directly from brands

How FMCG Brands are Unlocking their Sales Teams’ Full Potential through Gamification
Today gamification as a buzzword has been eclipsed by newer terms such as AI, ML and blockchain.

Infographic: Bizom Outcome Map
Are you considering automating your retail supply network? Before you even start looking around for a solution, ask yourself and your team
Why Online, Mobile-First DMS Might be the Best Bet for Indian FMCG Companies
Bizom offers a one-stop solution with seamless integration between Bizom’s sales force automation (SFA), retail execution & merchandising applications, and cutting-edge analytics.

How Bizom is Financially Impacting Millions of Small Retailers in India
Digitization sets off a virtuous cycle that improves the lives of small retailers, their families and the communities that they are such an important part ...

Seven competitive advantages FMCG companies gain from Bizom’s sales solutions
Bizom helps its customers succeed today by creating a ripple effect of efficiencies...

Empowering Indian FMCG’s frontlines with Bizom’s Sales Force Automation Solution
With Bizom, we know exactly how many retailer claims we are accepting as well as our claims that are processed by the company.

Parle Agro: A Case Study On Digital Sales Transformation
Parle Agro partnered with Bizom to streamline their sales force and increase their productivity..

7 steps to increase productivity of your sales force by over 70%
We also measure/ refine the business steps the organisations take to reach/surpass that level of productivity gain.

5 things that will make you a data driven organisation
Automation works best when you would like to scale up fast seamlessly..